

American Express (AXP) should deliver steady third‑quarter growth. Analysts expect stronger card‑fee revenue and resilient premium spending. The company continues to expand travel and entertainment volumes, which support revenue momentum. Moreover, rising net interest income should lift earnings despite credit‑cost pressure.
Investors should watch guidance updates. Analysts see mid‑to‑high single‑digit revenue growth if spending trends stay firm. However, valuation limits near‑term upside. Still, AXP can outperform if travel demand accelerates and card‑fee growth remains strong.
Elliott Wave Outlook: AXP Weekly Chart March 08th, 2026
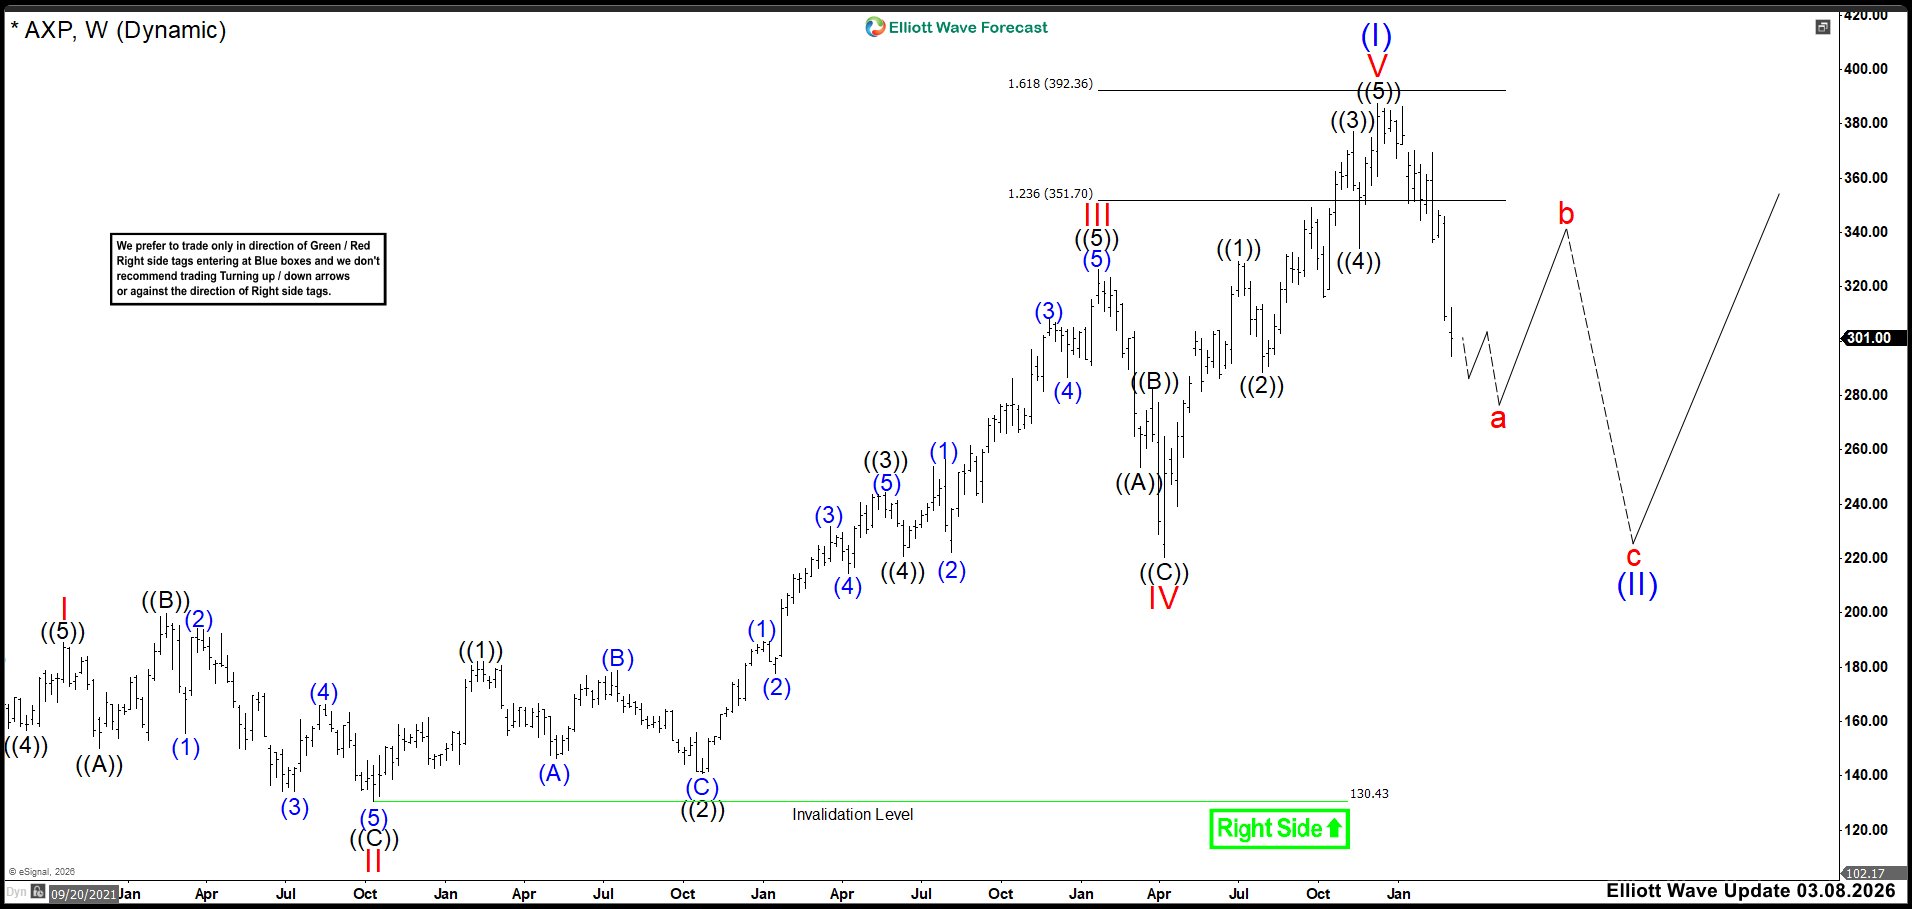
In the March update, we expected AXP to complete the impulse that started in April 2025. We marked that advance as wave ((1)) and looked for extension. However, the strong reaction from the extreme zone indicated that the 2020 cycle likely ended.
We expected a solid rebound that would confirm the end of wave a. Then we projected that rebound would fail and restart the decline. That’s why we stayed cautious, since AXP could still break below 200 dollars.
Elliott Wave Principle Behind the Market Structure
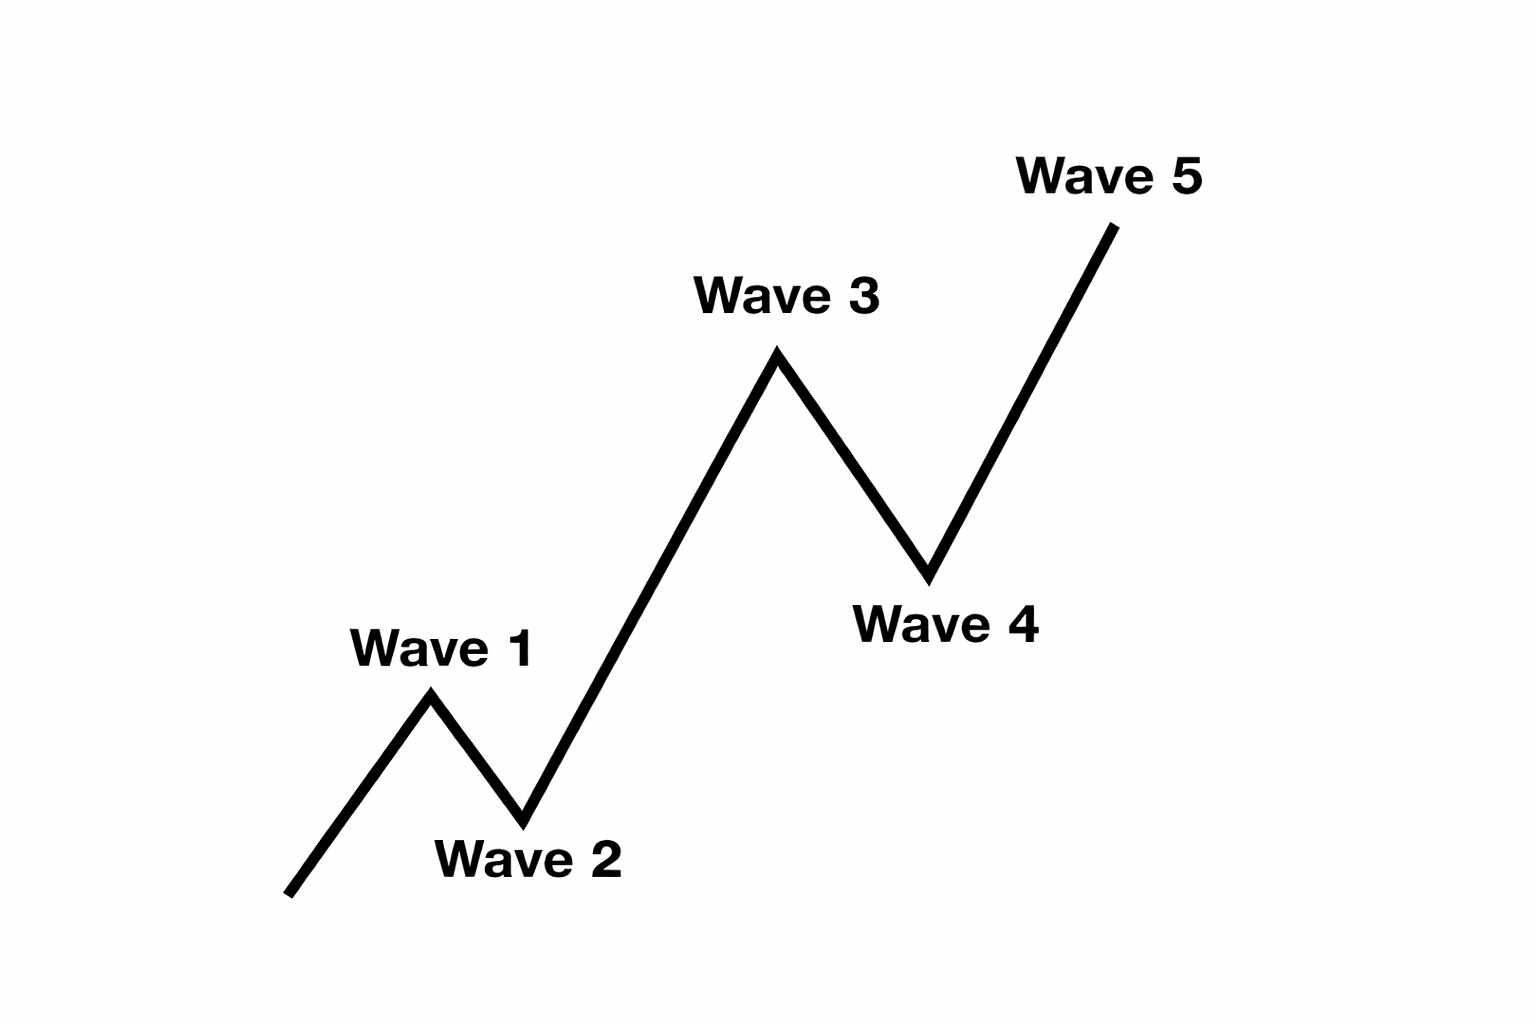
Impulse
An impulse is a clean 5‑wave pattern that drives the trend forward.
Waves 1‑3‑5 are strong and directional.
No overlap between waves 1 and 4.
Wave 3 is usually the strongest.
Structure is clear, with increasing momentum.
Elliott Wave Outlook: AXP Weekly Chart June 20th, 2026
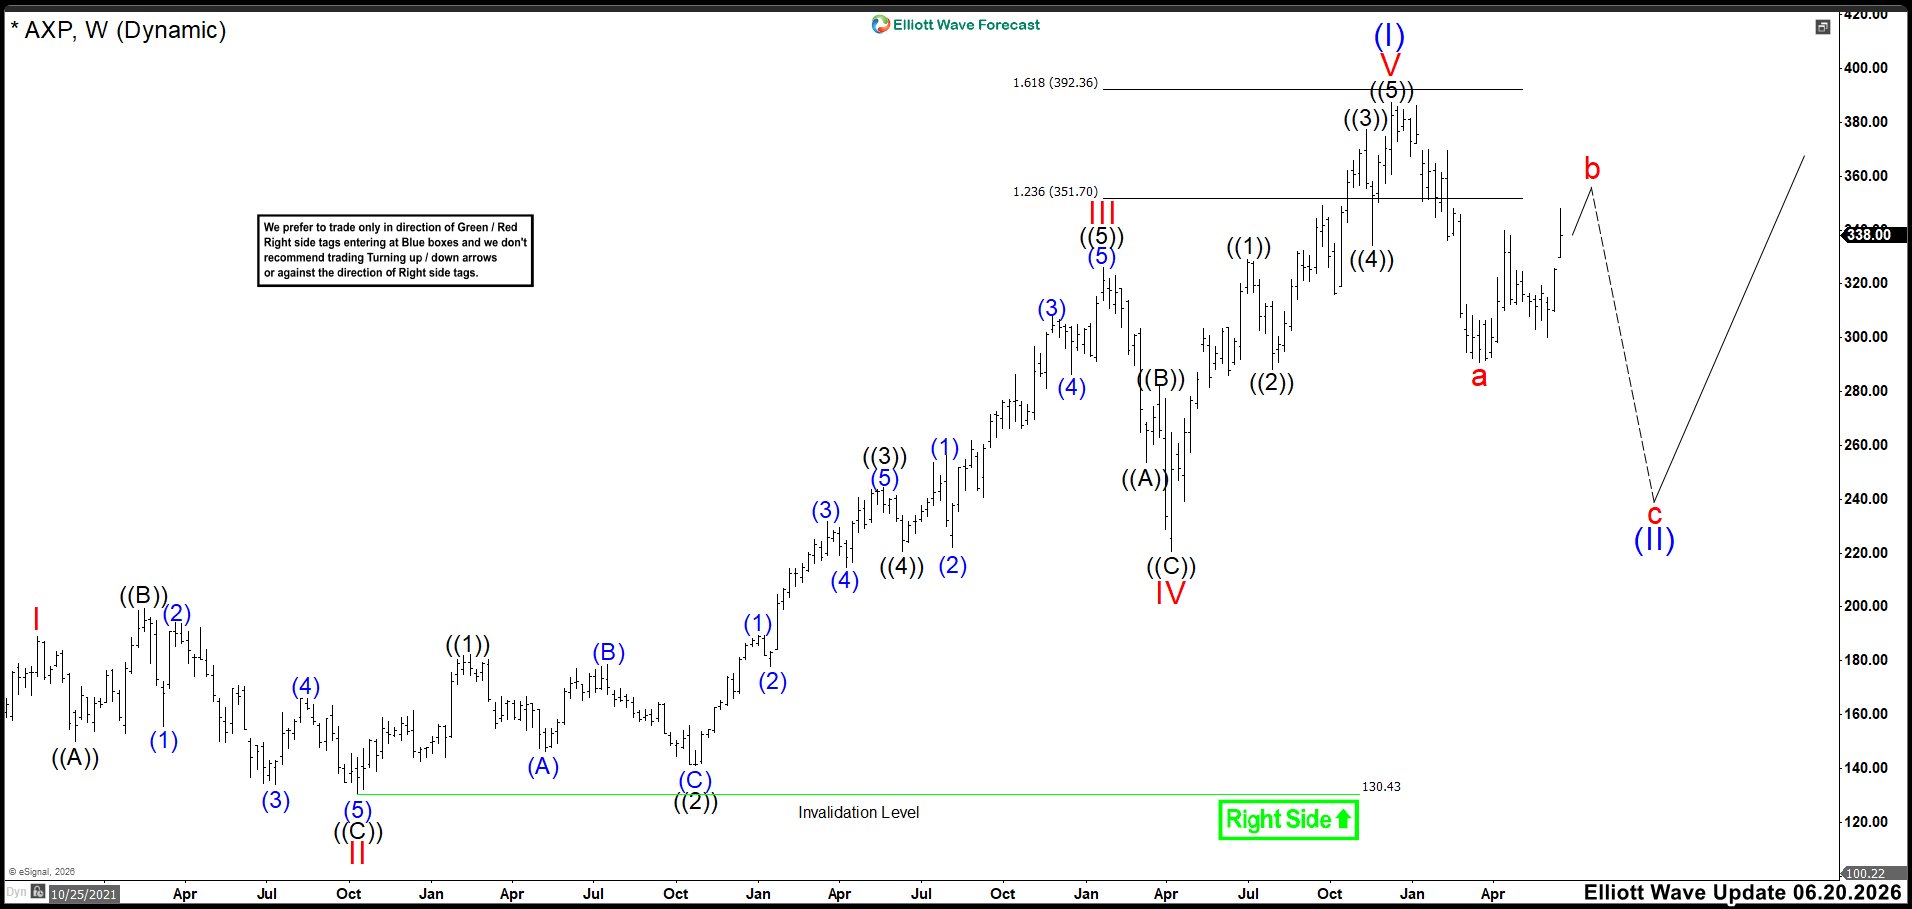
AXP continues to advance within the bullish cycle that started in 2020. The price reached the 1.236 and 1.618 extensions, which confirms strong momentum and supports the larger corrective structure. The count shows wave a already ended, and the market now develops the correction in wave b. This structure allows wave b to be complete and wave c already in progress. However, the chart still allows one more high toward 350–360 before the corrective cycle turns lower again.
After that potential high, we expect AXP to turn down and deepen wave c. In that scenario, we monitor the 200–250 region, where we project the end of wave (II). That zone should show clear signs of exhaustion and set the foundation for the next bullish cycle.


Comments
Log in or sign up to join the conversation.