


The Forex market has become broadly more interesting to traders in recent days as volatility has picked up and high-impact economic data releases, both historical and anticipated, start to influence expectations and generate some excitement. Adding to the sense of anticipation is the imminent end of the “summer market” as September looms, and the feeling that market focus might shift away from an overbought stock market and towards other asset classes such as Forex. Of course, the month of August has brought disappointments before.
The release of Australian inflation data earlier today saw a weaker than expected fall to 3.5% from 3.8%, which is a hawkish surprise, making a future interest rate hike more likely. This news boosted the price of the Aussie, sending it higher against almost all other currencies.
The US Dollar is trading sideways ahead of highly important economic data which will be released today, most notably the inflation indicator Core PCE Price Index. If higher than expected, it will boost the USD; if lower, it will send it lower.
These data points suggest today is going to be an active day in this currency pair, which has already been in some focus for technical reasons.
AUD/USD Technical Analysis
The price has recently continued and accelerated its bearish trend, as evidenced from the bullish breakout above the linear regression analysis marking a dominant bullish price channel. A few hours ago, the price made a new near 3-month high. These are bullish signs, as is the new support level at $0.7176.
The Australian Dollar has been in a clear bullish trend. The US Dollar is in a bearish trend but has shown signs of stabilising over recent days.
I think that if the new nearest support level at $0.7176 continues to hold into the New York session, we will be primed for a bullish breakout. However, what happens next technically will almost certainly depend on the US data which will be released as that session gets underway, especially the PCE. If that number is lower than expected (0.2% increase month-on-month), then that bullish breakout will be likely to happen.
The problem for bulls in this scenario is that there is a key resistance level nearby which is confluent with the round number at $0.7200 and this might hold the price for the day. Still, a short from a rejection of that level would be very bold and not something I would be looking for.
If the support at $0.7176 breaks down first, a volatile trip down to the $0.7150 area becomes a reasonable scenario.
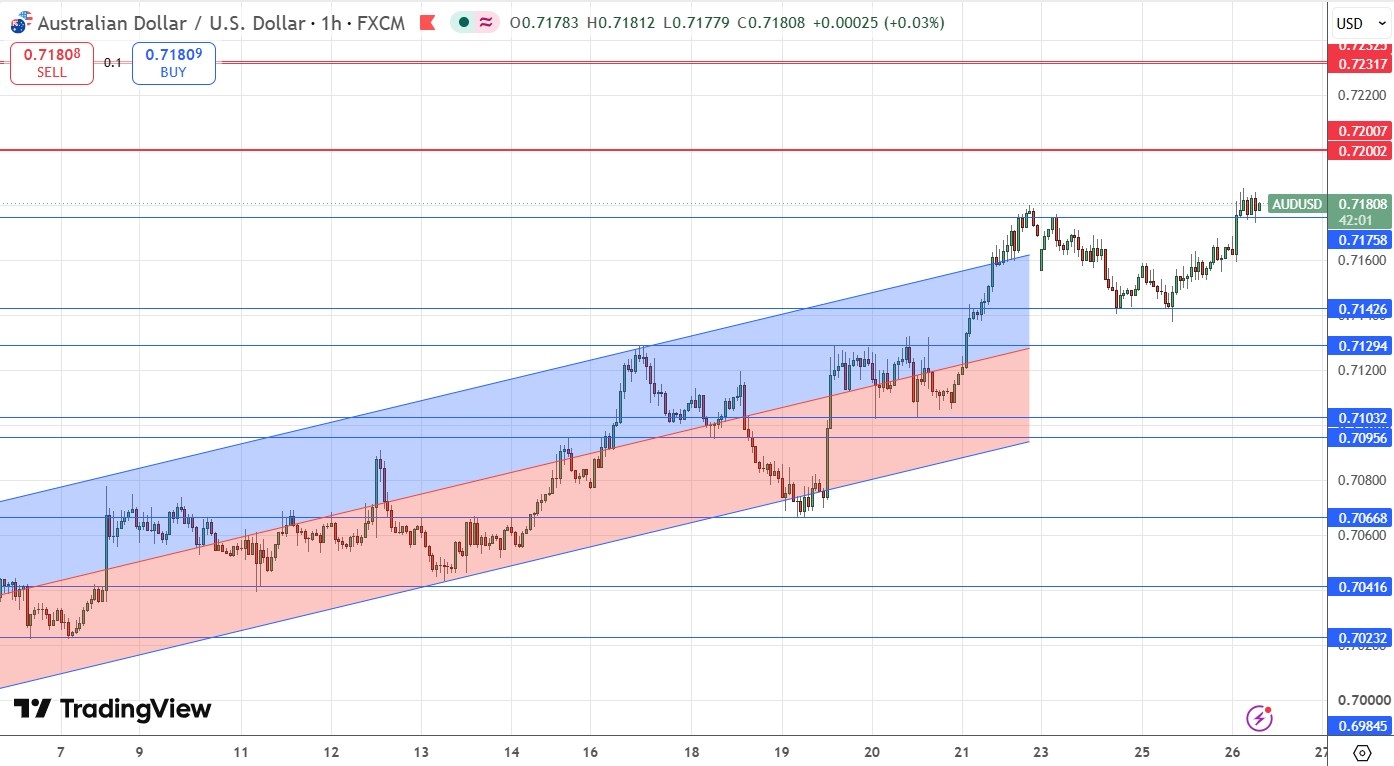
AUD/USD Price Chart
The only bearish technical factor is that this is (so far) the third day in which the price has topped at about 0.7130, so there is some struggle to rise. Yet the action does suggest a breakout looks likely today.
The best opportunity today could be a long trade following a breakout to a new two-month high price above 0.7130 or following a retracement and bullish bounce rejecting 0.7100 / 0.7096.
Support & Resistance Levels
Risk 0.25%.
Trades may only be entered prior to 5pm Tokyo time Friday.
Short Trade Idea
Short entry following a bearish price action reversal on the H1 time frame immediately upon the next touch of 0.7200, $0.7232, or $0.7275.
Put the stop loss 1 pip above the local swing high.
Move the stop loss to break even once the trade is 20 pips in profit.
Remove 50% of the position as profit when the price reaches 20 pips in profit and leave the remainder of the position to ride.
Long Trade Ideas
Long entry following a bullish price action reversal on the 1H1 time frame H1H1H1 time frame immediately upon the next touch of $0.7168, $0.7143, or $0.7133.
Put the stop loss 1 pip below the local swing low.
Move the stop loss to break even once the trade is 20 pips in profit.
Remove 50% of the position as profit when the price reaches 20 pips in profit and leave the remainder of the position to ride.
The best method to identify a classic “price action reversal” is for an hourly candle to close, such as a pin bar, a doji, an outside or even just an engulfing candle with a higher close. You can exploit these levels or zones by watching the price action that occurs at the given levels.
There is nothing further of high importance scheduled today concerning the Australian Dollar. Regarding the US Dollar, there will be a release of Core PCE Price Index and Preliminary GDP data at 1:30pm London time.

Comments
Log in or sign up to join the conversation.