

AUD/NZD since March 13/2017 has been moving lower. There are possible bullish patterns that can push the pair higher but traders need to see AUD/NZD price action slow down and show possible signs that it wants to reverse and bounce higher.
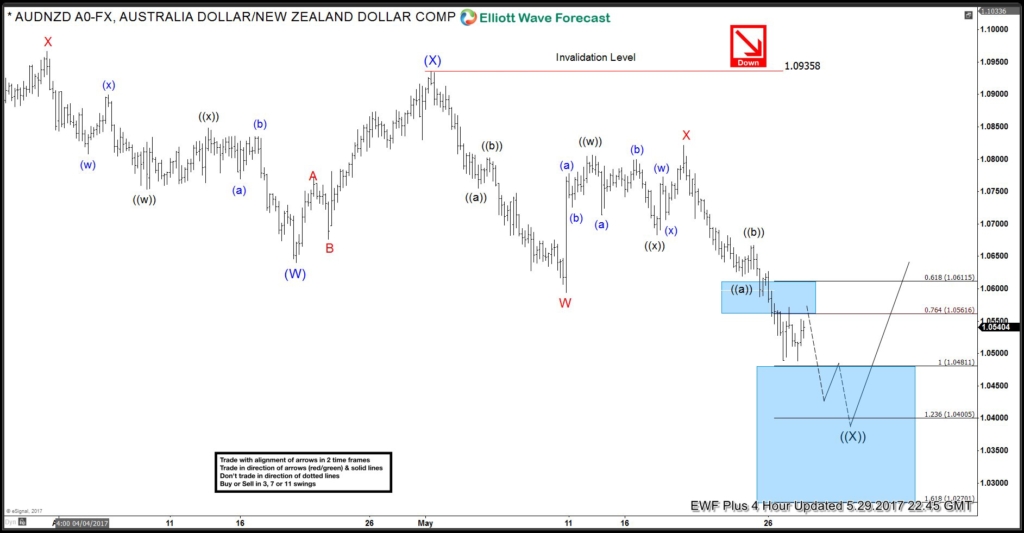
AUD/NZD 4 hour Elliott Wave Analysis May 29/2017: The pair can find support at the inflection zone (Blue box) where wave ((X)) can terminate and possibly bounce higher.
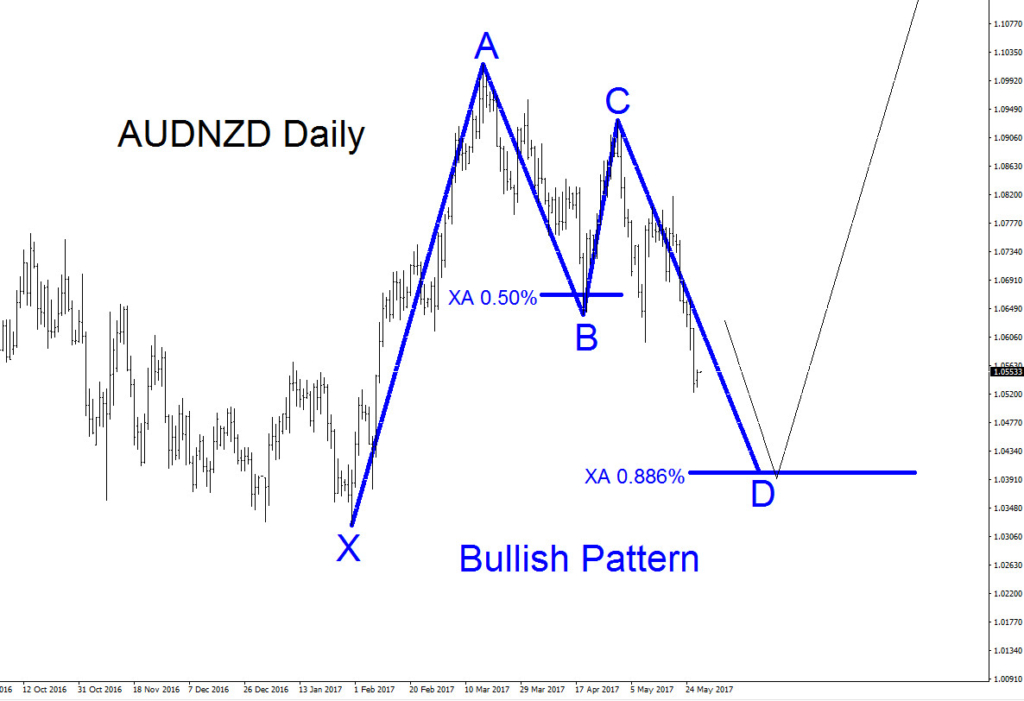
AUDNZD Daily Bullish Pattern #1: Bullish pattern triggers BUYS at the XA 0.886% Fib. level coinciding with the above inflection zone (blue box). Only a break below point X of the blue pattern will invalidate the bullish pattern.
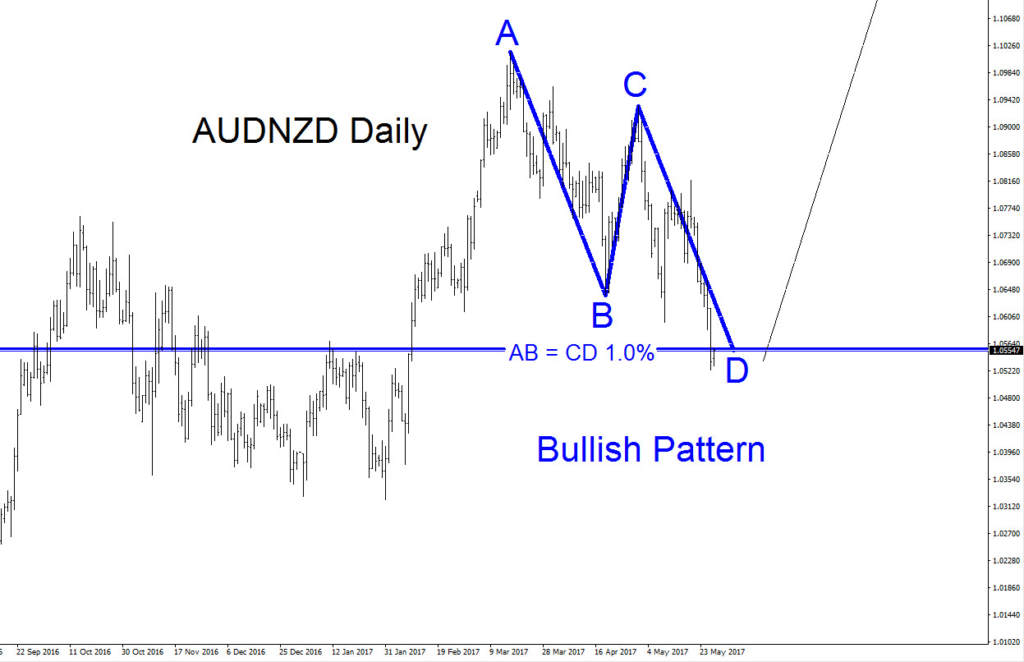
AUDNZD Daily Bullish Pattern #2: There is also a possibility of AUDNZD not pushing lower and reversing higher from current levels. A bullish AB=CD pattern has already been triggered at the 1.0% Fib. extension level. As long as price stays above 1.0323 AUDNZD can bounce higher.
If looking to buy AUDNZD we prefer the blue bullish pattern #1 setup. Stops should be placed at 1.0323 (point blue X low) and should be bought at the XA 0.886% Fib. level (1.0402) minimum for a better risk/reward trade with targets above the point A high of the blue pattern #1.
Of course, like any strategy/technique, there will be times when the strategy/technique fails so proper money/risk management should always be used in every trade.



Comments
Log in or sign up to join the conversation.