

Image Source: Unsplash
Since our December 19, 2025 technical outlook, AUDNZD has exhibited a sharp and powerful rebound, validating the bullish structure we anticipated. Price has decisively moved above the 2022 highs and continued its advance as part of wave (C). Following the breakout from a fourth wave triangle, this extension is now interpreted as wave V of the developing impulse from the 2025 low.
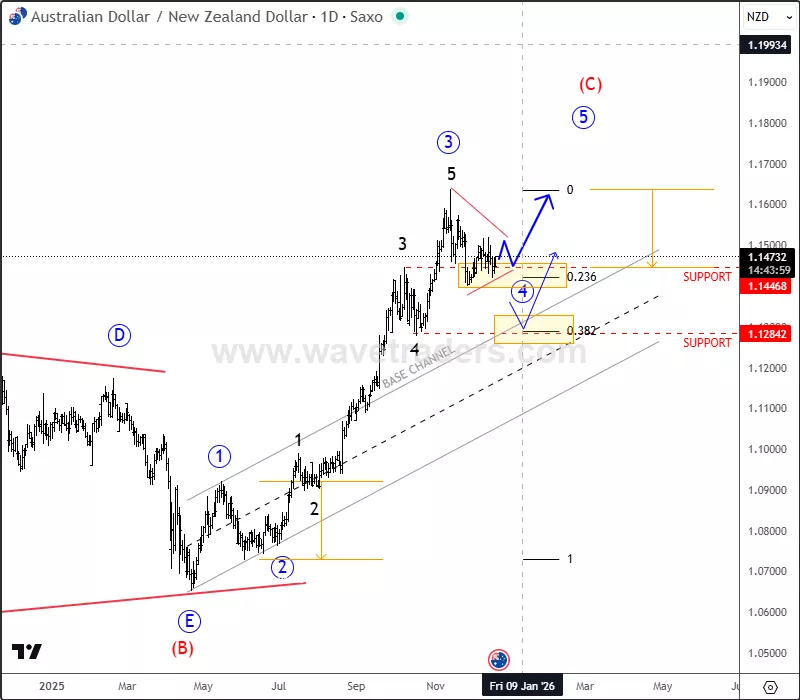
AUDNZD Daily Chart From December 19 2025
While the momentum remains strong, the market is entering the late stages of this impulsive sequence. That suggests the pace of the rally may moderate as price approaches the 1.1750–1.1800 resistance area. Traders should be aware of a possible slowdown, consolidation, or corrective reactions in this zone before any further extension.
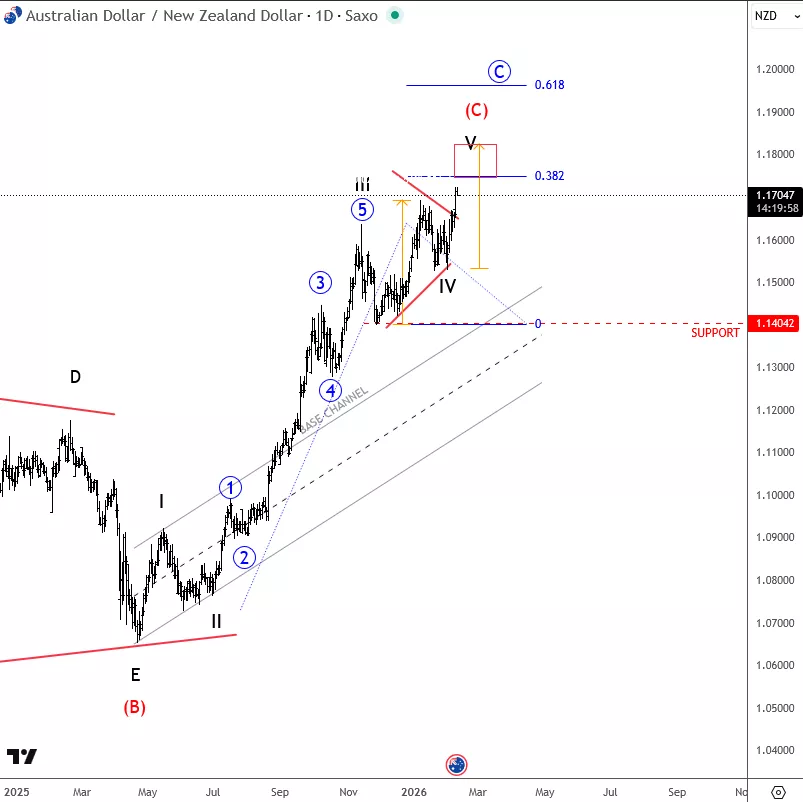
AUDNZD Daily Chart From February 10 2026
Key levels to watch:
-
Support: Previous triangle breakout zone / short-term structure lows
-
Near-term resistance: 1.1750–1.1800 (potential reaction area for a slowdown or corrective pullback)
-
Continuation trigger: Break and sustained trade above recent swing highs
In summary, the bullish structure is intact and gains remain valid, but caution is warranted as AUDNZD nears a key resistance cluster where the impulse may lose steam.
More By This Author:
Bitcoin Cash Technical Outlook: Signs Of A Potential Bottom Forming
Bitcoin Market Update: The October 2025 Top And The Road Through Wave IV
AMD Faces Sharp Downturn After Disappointing Q1 Outlook


Comments
Log in or sign up to join the conversation.