


Image Source: Unsplash
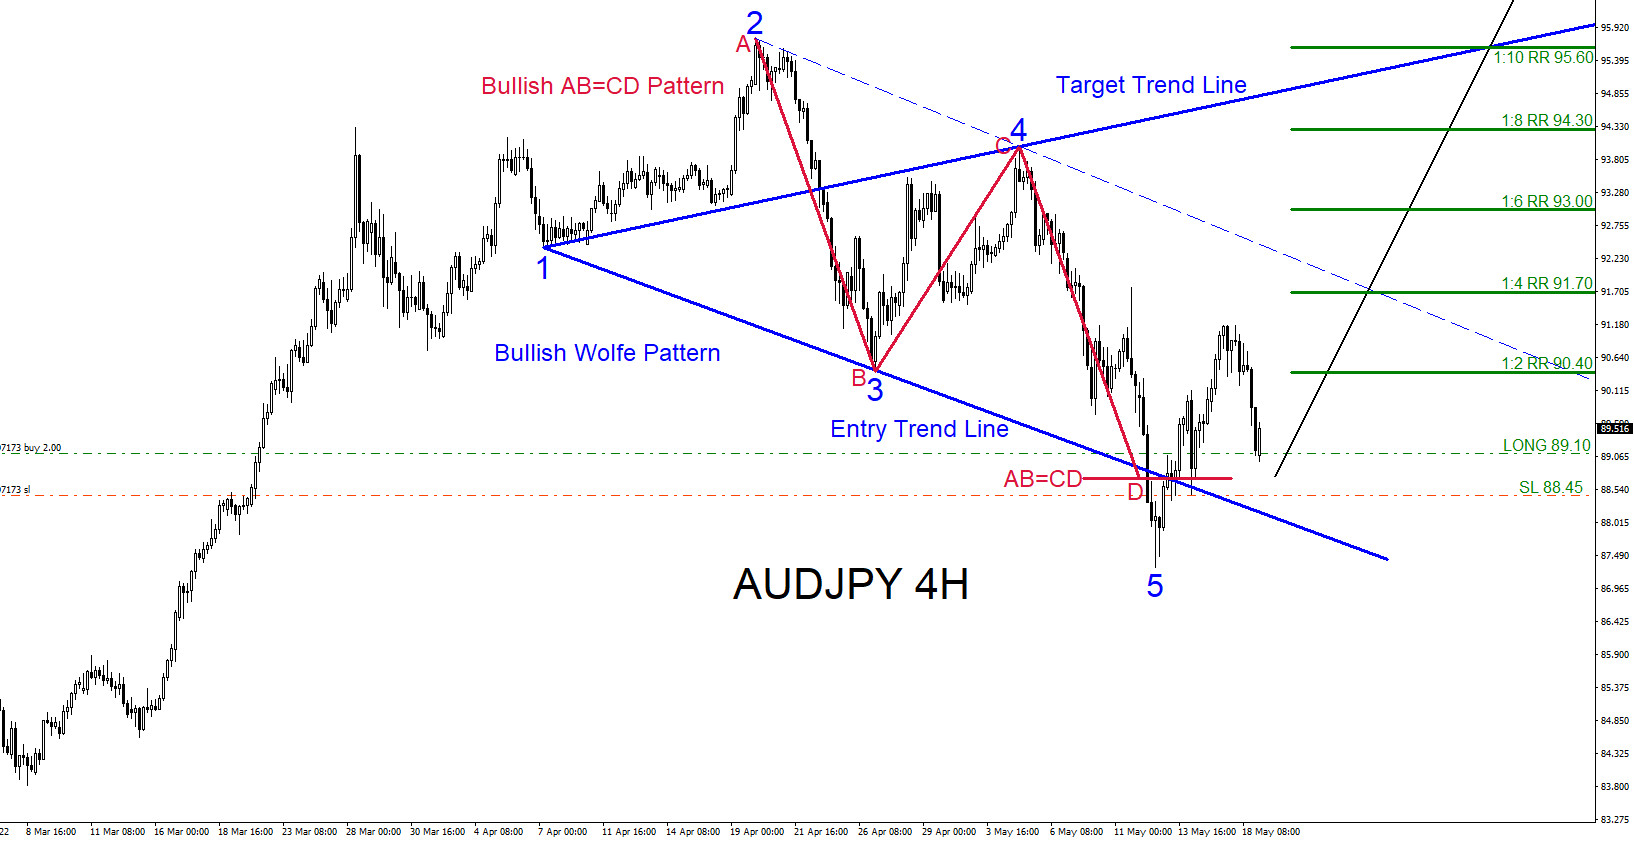
On May 18, 2022, I posted the AUD/JPY four-hour chart bullish scenario to social media. In the chart below, there were clear, visible bullish market patterns that were calling for a move higher. The blue bullish market pattern already triggered buy signals at the entry line where point 5 terminated.
The red bullish pattern also triggered buy signals at the AB=CD level. The pair reacted with a move higher, and I entered the trade on the retracement at 89.10 with a stop loss at 88.45. My target minimum was 90.40 (1:2 RR), and my maximum was 95.60 (1:10 RR). Only a move below 87.29 would have invalidated both bullish patterns.
AUD/JPY Four-Hour Chart for May 18, 2022
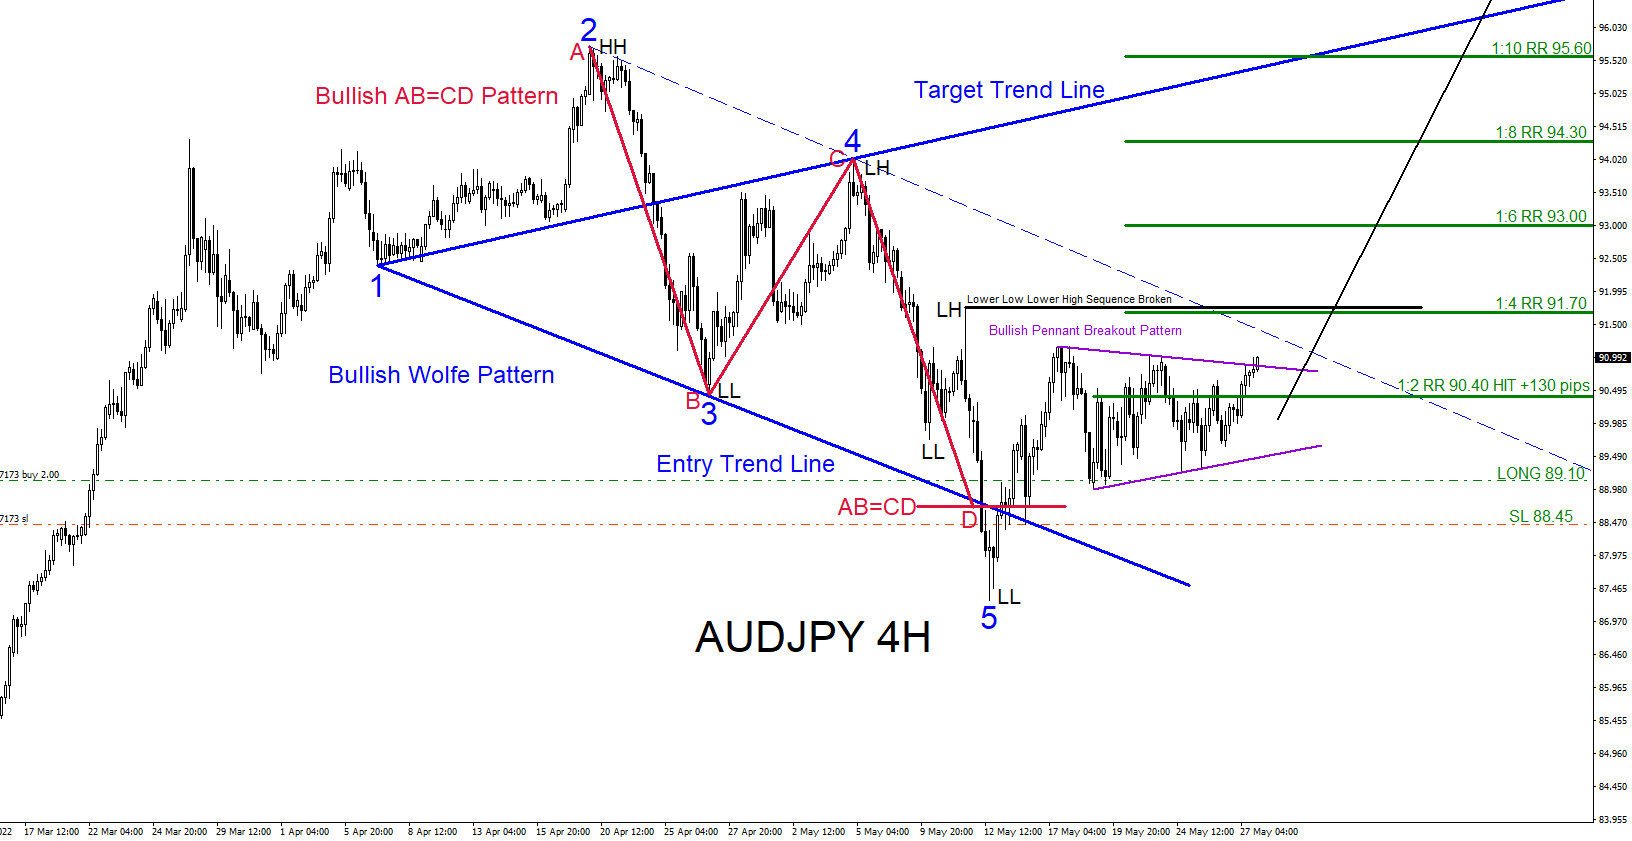
The minimum target at 90.40 was hit for +130 pips on May 19, 2022. Before the close of the trading week, on May 28, 2022. a bullish pennant pattern (purple) formed. The price broke and closed above the top of the pennant, adding more evidence that the pair could continue pushing higher.
Another signal of a move higher would be if the price breaks above the previous lower high, confirming the bearish LL/LH (Lower Low/Lower High) sequence is over. How high will the AUD/JPY pair rally from here? Only time will tell.
AUD/JPY Four-Hour Chart for May 28, 2022
A trader should always have multiple strategies all lined up before entering a trade. Never trade off one simple strategy. When multiple strategies all line up, it allows a trader to see a clearer trade setup. If you followed me on social media, you could have caught the AUD/JPY trade setup.



Comments
Log in or sign up to join the conversation.