

- Crypto market recovers in five wave structure
- ATOMUSD unfolds final wave E of (B)
- BANDUSD trades into a bearish running triangle
Crypto market has recovered with five waves on the smaller time frame, so seems like a new three-wave A-B-C recovery is in progress, but nothing bullish yet. As we can see, most of Cryptos hasn't reached new lows yet, so bearish triangles look to be bigger and longer before we will see a break into new lows, maybe and ideally at the end of July or beginning of August.
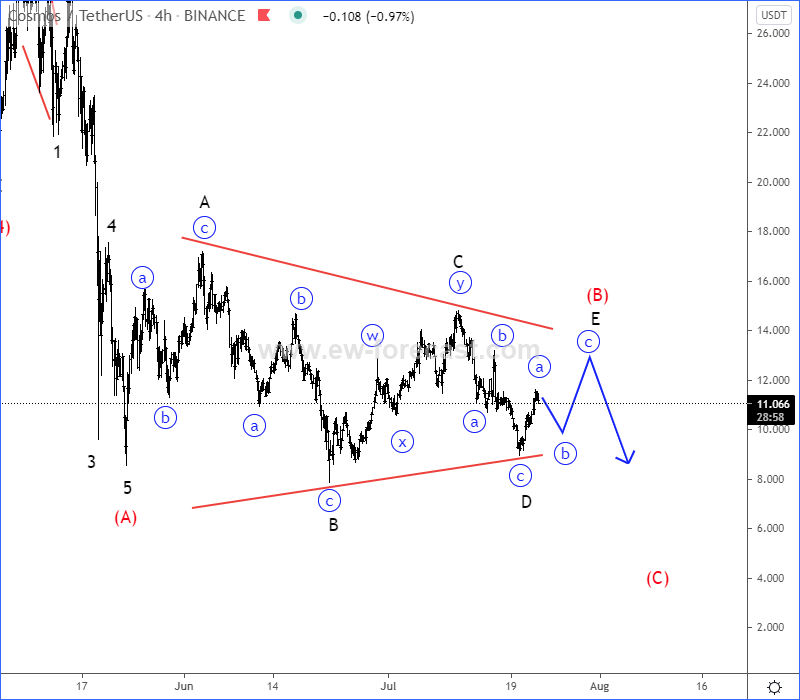
Despite the recent intraday jump, most of Cryptos still trading sideways, ideally as part of bearish triangle patterns. One of them is also ATOMUSD, in which we see a quite clear wave structure, where we are tracking now the final wave E of (B) that can be made by a three-wave a-b-c recovery before another sell-off back to lows for wave (C) occurs.
ATOMUSD 4h Elliott Wave Analysis Chart
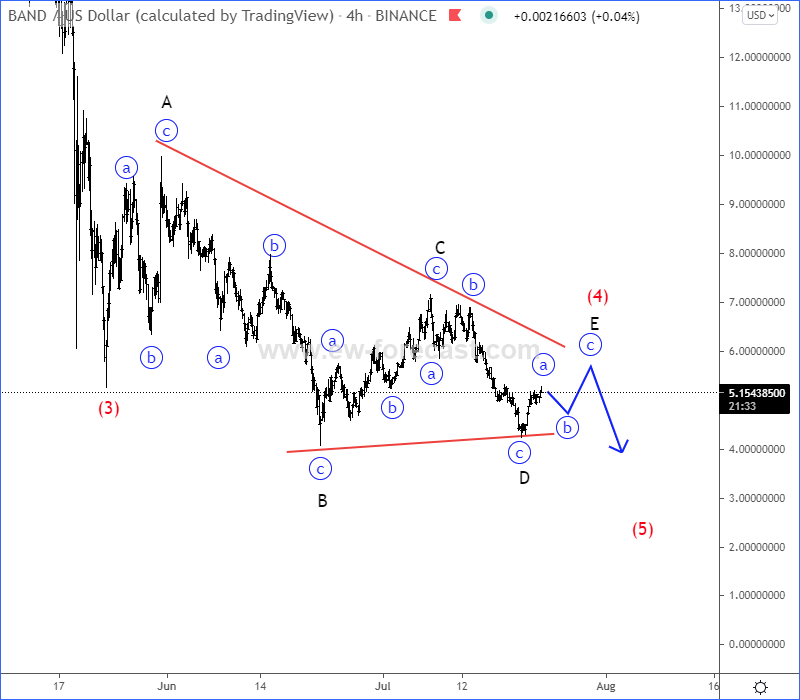
Even BANDUSD can be trading in the final stage of a bearish running triangle pattern within wave (4) as final wave E can be in progress which can be made by a three-wave a-b-c recovery before we will see a continuation lower within wave (5).
BANDUSD 4h Elliott Wave Analysis Chart


Comments
Log in or sign up to join the conversation.