
The implication of a (massive) revision to the expected path of government debt relative to baseline is an increase in the slope of the yield curve. Some portion comes from the expectations hypothesis of the term structure, some from an increase in the risk premium. [lecture notes on portfolio crowding out] [lecture notes on expectations hypothesis of term structure]
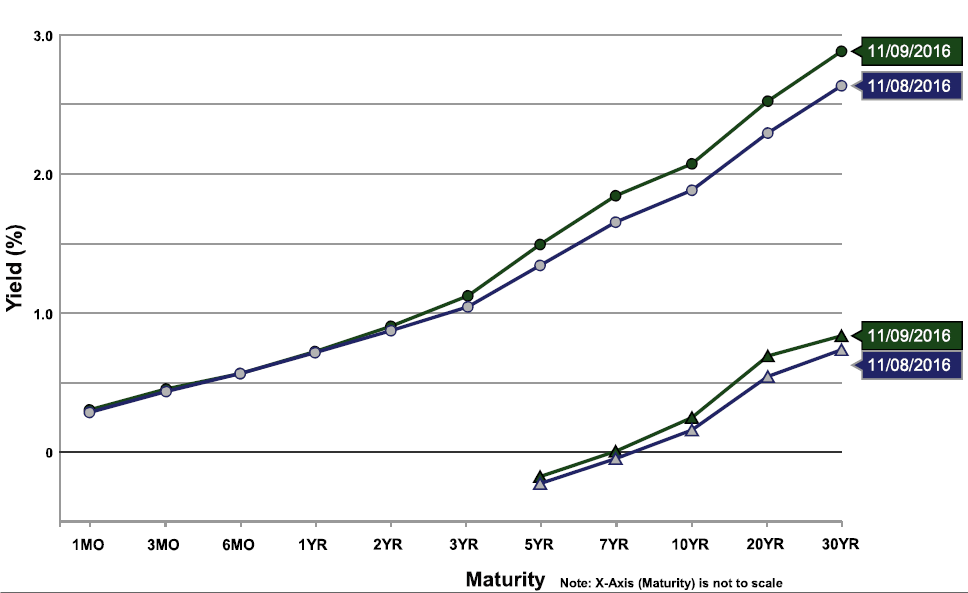
Figure 1: Yield curve as of 8 November (blue), and 9 November (green). Source: US Treasury.
That’s a remarkable jump for one day. A one-day 20 basis point change is large given the one standard deviation is 5.4 basis points (over the 2009M06-2016M11 period). A time series plot of the ten year yield is shown in Figure 2.
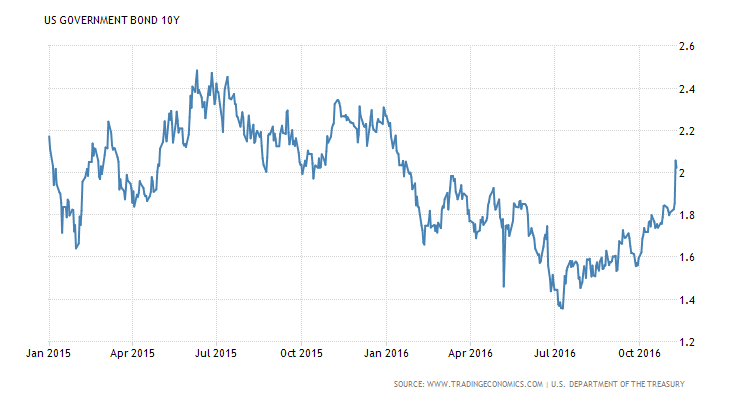
Figure 2: US Government ten year bond yield. Source: TradingEconomics, accessed 9 Nov 2016.
From Bloomberg:
Treasuries plunged, with 30-year bond yields climbing the most since at least 1977, amid concern that a Donald Trump administration and a Republican-led U.S. Congress will unleash a wave of spending to boost the U.S. economy, triggering a surge in inflation.
Adjusted for current yield levels, which are close to historical lows, the magnitude of the day’s rise hasn’t been exceeded in data compiled by Bloomberg going back to February 1977. Benchmark U.S. 10-year yields rose above 2 percent for the first time since January as a bond-market measure of inflation expectations climbed to the highest since July 2015. A gauge of the yield curve steepened as longer-dated debt underperformed.
However, in contrast the unrealized fears of crowding out in the past, I do not expect any anxieties to be voiced by Representative Ryan this time around.


Comments
Log in or sign up to join the conversation.