


Every time interest rates rise, the “bond bears” flood the media with commentary suggesting US Treasuries are no longer a “safe asset.”
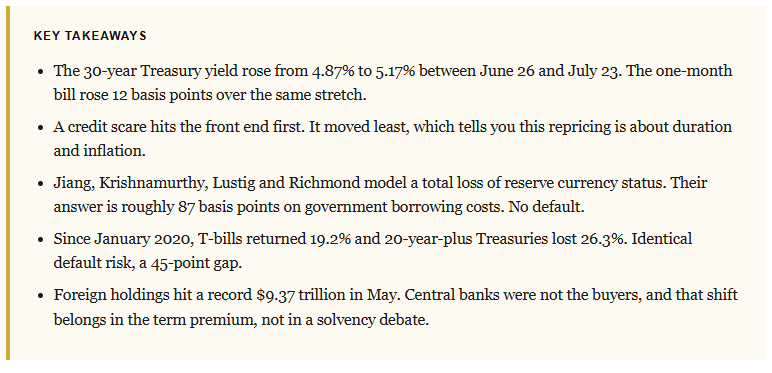
The 30-year Treasury bond closed last Thursday at 5.17%. Meanwhile, the 10-year touched 4.71%, its highest print since January 2025, while Brent crude pushed above $100 as the Iran conflict escalated. Add a Fed meeting this week, and right on schedule, the Treasury safe asset debate reopened. A careful new paper from Hanno Lustig and three coauthors is now getting cited as proof that the world’s reserve asset is finished. I’ve read the paper, and it is good work. It also doesn’t say what most of the people quoting it think it says.
Start With What The Tape Actually Did
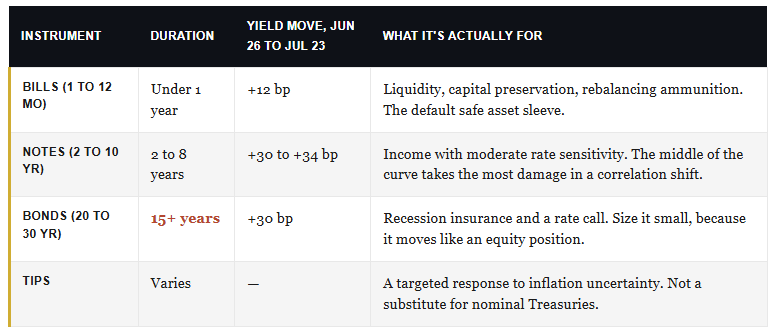
Between June 26 and July 23, the long bond repriced up 30 basis points (bps). The five-year moved 34 bps, and the 10-year moved 33 bps. And the one-month bill? 12 bps. That distribution is the entire story, and almost nobody writing about this week’s yield spike bothered to look at it.
Here’s why it matters. If markets were genuinely repricing the odds that Washington fails to pay, the front end would move hardest. Default risk applies to the payment due in four weeks just as much as to the one due in 2056, and short paper carries no term premium to cushion the blow. Instead, the bill barely budged. Bond investors weren’t questioning whether they would get paid. They were demanding more compensation for inflation and duration, which is a completely different trade. Treasury safe asset status was never in question; only the price of duration was.
Regular readers know I have been making this argument for months. Back in May, with the 10-year at 4.60% and the same doom commentary running, I put fair value closer to 5.3% based on nominal growth near 6%. Only modest upward pressure remained, I argued. We’re at 4.69% today, even though the “experts” suggest that rates have been “broken” for about three years now.
What The Treasury Safe Asset Paper Actually Argues
However, let’s make sure to properly examine this topic. The sloppy version of the argument is easy to knock down, and the real version isn’t.
Zhengyang Jiang, Arvind Krishnamurthy, Hanno Lustig, and Robert Richmond published their work on July 20. They document three things. The convenience yield on public dollar safe assets has compressed from its 2022 peak toward zero. That erosion sits almost entirely in public debt, since the premium on private dollar claims held roughly steady. And the foreign share of public dollar bonds slid from about 45% to about 30% across the past decade.
Then they build a two-country model and ask the cleanest possible question. What happens if foreign demand for dollar safety goes to ZERO? Not declines, or softens, but vanishes completely and permanently. In other words, the entire premium foreign investors have paid for decades to hold dollar safe claims simply disappears from the global financial system and never comes back.
Their answer:
The real dollar depreciates 8.8%.
US real rates rise 87 basis points on government debt and 72 on private debt.
The lost seigniorage capitalizes to something near 107% of GDP.
Their own framing of the policy implication is that the bill gets paid “mainly in higher fiscal burden and lost wealth, not in a manufacturing renaissance.”
Read that number again. The complete, permanent collapse of the dollar’s reserve status is worth 87 bps on Treasury yields.
The long bond moved 30 bps last month because of oil. So the apocalypse scenario, fully specified by the economists who built the model, amounts to roughly three of the moves we just absorbed for reasons unrelated to fiscal solvency. And in that scenario, every Treasury still pays every coupon and matures at par. That is a repricing of the Treasury safe asset, not a repudiation of it.
Duration Is The Risk, And It Always Was
Which brings us to the part of this debate that actually costs investors money. Not the reserve currency question. The maturity you bought.
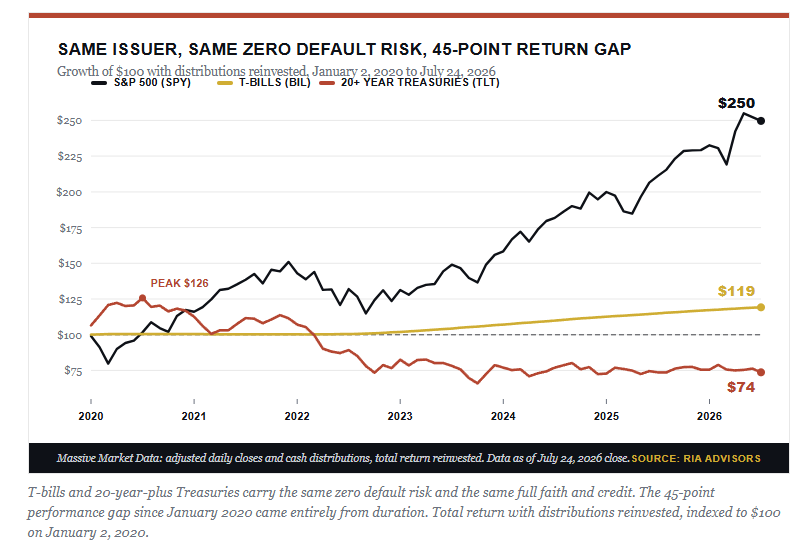
A hundred dollars put into T-bills on January 2, 2020, is worth $119 today. The same hundred in 20-year-plus Treasuries is worth $74. Same issuer. Both carry identical statutory backing and default at exactly the same rate, which is to say never, and yet one of them never suffered a drawdown and sits at its all-time high this week, while the other peaked at $126 on August 4, 2020, and is down 41.7% from that mark even counting every coupon.
That’s not a safety failure. It’s arithmetic. TLT carries an effective duration of 15.08 years as of Thursday, meaning roughly 15% of the price for every 100 basis points of yield. Anyone buying the long end in 2020 at a 1.2% yield was making a leveraged bet that rates would fall further, whether they understood the position that way or not.
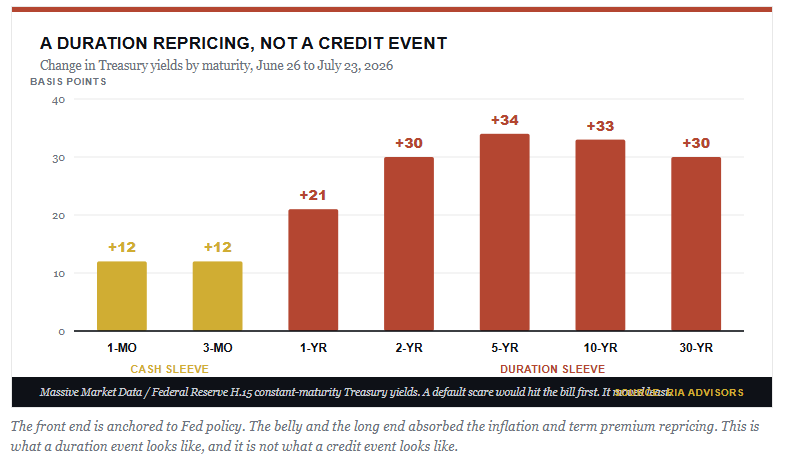
So when the headlines say Treasuries “failed,” ask which Treasuries. The people who got hurt owned the long end while needing their money back within a few years. If your goal is stability, bills are the Treasury’s safe-asset sleeve, and duration is an entirely separate decision. Confusing those two roles is what produced most of the damage since 2020.
Where The Treasury Safe Asset Bears Have A Point
“But Lance, the foreigners are walking away.”
Partly true, and I’m not going to wave it off, because central banks and official institutions held $3.85 trillion of Treasuries in May, down 0.8% from a year earlier, and that aggregate holds up no matter how you cut the country detail. The foreign share of marketable debt has genuinely compressed, too, mostly because supply grew faster than foreign appetite. Lustig and his coauthors put that share near 30%, and the TIC data agrees with them, which counts for something when two independent methods land in the same place.
Where the bear case overreaches is the China line, and that’s the number getting screenshotted most often. China’s reported holdings fell by $73 billion over the past twelve months. Belgium, home to Euroclear, added $57 billion over the same window; Luxembourg, home to Clearstream, added $23 billion; and adding the three together leaves the bloc up $7 billion from where it sat a year ago. Flat.
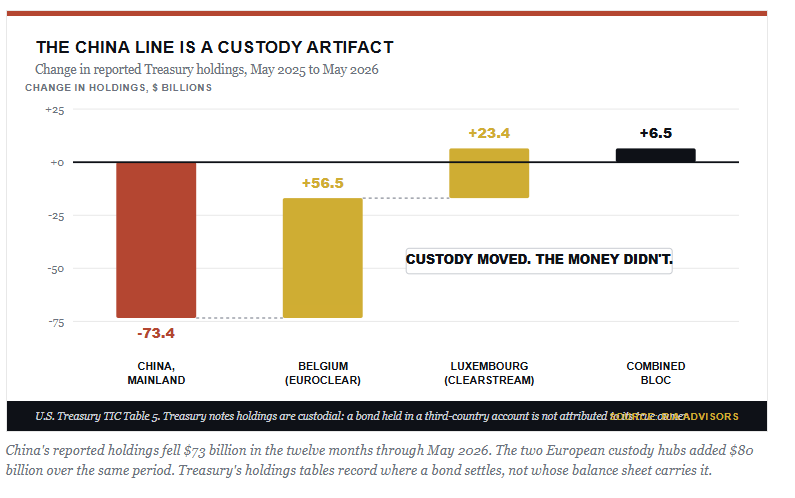
As we walked through in February, the TIC tables are built from custodial data, and Treasury’s own FAQ warns that a bond held in a third-country account won’t reflect its true country of ownership. I can’t prove every dollar that left the China line reappeared in Brussels or Luxembourg, since both hubs serve institutional clients worldwide. But the offset is nearly exact. It tracks the pattern Brad Setser at the Council on Foreign Relations has documented for a decade, and it means that the line item is measuring settlement venue rather than intent.
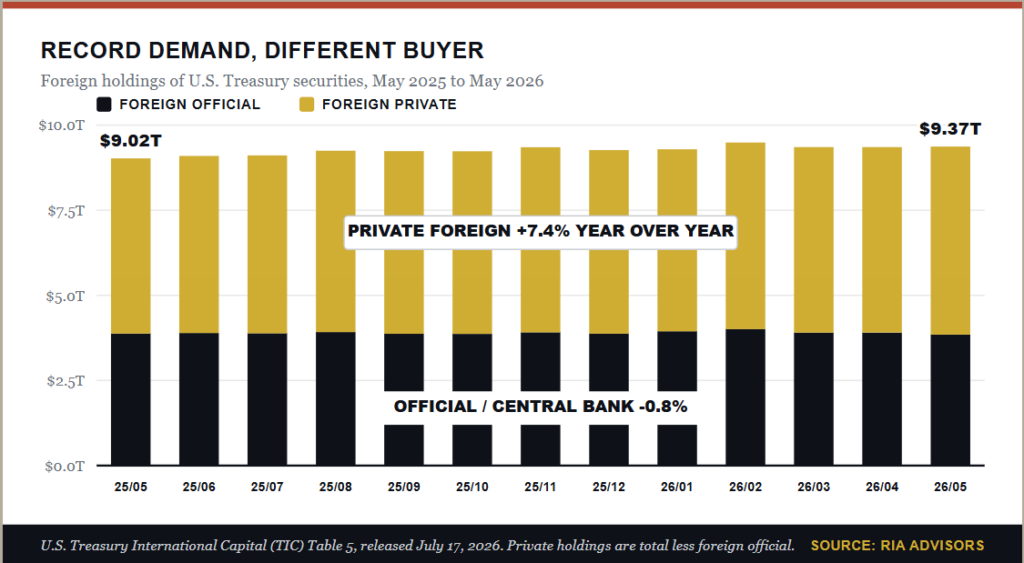
However, look at what the same data says about the total. Foreign holdings hit a record $9.37 trillion in May, up from $9.02 trillion a year earlier, with private investors adding 7.4% while official institutions trimmed. The marginal buyer is now a private balance sheet rather than a foreign central bank. That’s a real structural change, and it belongs in the term premium; however, it does not belong in a solvency debate.
Auction demand backs that up. Bid-to-cover ratios in June ran 2.72 on four-week bills, 2.40 on 10-year notes, and 2.30 on 30-year bonds, all above the 2.0 line that signals healthy demand. The average interest rate across the entire marketable debt sits at 3.411%, against 3.375% a year ago.
Where exactly is the funding crisis in those numbers?
Treasury Safe Asset Failure, Or Plumbing Failure?
Of course, March 2020 gets cited constantly as the moment the Treasury safe asset broke. Yields rose while stocks collapsed, spreads gapped, and settlement failures jumped.
What actually broke was the plumbing. Dealer balance sheets couldn’t warehouse the risk fast enough while leveraged players unwound into margin calls, and the Treasury market’s intermediation chain seized up even as the underlying obligation stayed exactly as good on Friday as it had been on Monday. Policymakers still debate microstructure fixes for this market. They don’t bother debating microstructure fixes for irrelevant ones.
The practical lesson is narrower than “Treasuries are unsafe.” Plan for liquidity to gap. Keep cash buffers so you are never a forced seller of duration into a drawdown. And never fund a long-duration position with financing that can be pulled at the worst possible moment. The asset survives that episode. A leveraged holder of it may not.
What Investors Should Consider
If you own treasuries, you need to make two separate decisions rather than one blended bet. The liquidity sleeve holds the bill exposure and does the work people mistakenly ask the long end to do. The duration sleeve stays deliberately small, sized as recession insurance rather than as a conviction call on falling inflation. That distinction matters right now, with crude above $100 and July prices-paid data firming. Here are some steps to follow:
Match maturity to your spending horizon.
If you need the cash inside two years, build a ladder of bills and short coupons and stop there.
Set rebalancing bands in advance and execute them without consulting your feelings, because the most expensive mistake in this asset class is selling long Treasuries after the drawdown and buying them back after the rally.
So, what would change my view? That is a fair question, and it’s one the doom crowd never answers about its own thesis. Such is why I’ll put my falsification conditions on the record rather than leave myself room to reinterpret the data later. Here are the triggers:
Bid-to-cover ratios on 10s and 30s broke below 2.0 across consecutive auctions, with primary dealers absorbing a rising share of the takedown.
The front end started rising more than the long end, since that inversion of today’s pattern is the actual signature of credit fear.
Sustained US sovereign CDS trading wide of comparable sovereigns would do it too.
None of those conditions show up in the July data. Until they do, a 5.17% long bond is a repricing, and a repricing improves forward returns for the next buyer while punishing the last one.
Treasury safe asset status was never a promise about price. It was a promise about payment, and that promise is intact.
Sources and notes
Treasury yields by maturity: Federal Reserve H.15 constant-maturity series via Massive Market Data, pulled July 25, 2026. Curve data through the July 23 close, cross-checked against Trading Economics and the Forbes daily Treasury table.
Total return series: adjusted daily closes and cash distribution history via Massive Market Data, reinvested. Indexed to January 2, 2020. Prices as of the July 24, 2026 close, market closed. TLT close cross-checked against Yahoo Finance and TradingView.
TLT effective duration of 15.08 years and average yield to maturity of 5.23%: iShares fund page, as of July 23, 2026.
Jiang, Z., Krishnamurthy, A., Lustig, H., and Richmond, R., “Dollar erosion: The macroeconomic consequences of losing reserve currency status,” CEPR / VoxEU, July 20, 2026.
Acharya, V. and Laarits, T., “Tariff War Shock and the Convenience Yield of US Treasuries: A Hedging Perspective,” NBER Working Paper 34640, 2026. Finds the short end retained its safe-asset hedging property while long-bond convenience yield covariance rose.
Foreign holdings, including the Belgium and Luxembourg custody detail: U.S. Treasury International Capital (TIC) Table 5, May 2026 data released July 17, 2026. Treasury notes these holdings are collected primarily on a custodial basis and may not identify beneficial ownership.
Custodial bias and the Euroclear / Clearstream routing: Is China Really Dumping US Treasuries?, RIA Advisors, February 23, 2026, drawing on Brad Setser, Council on Foreign Relations.
Marketable debt outstanding, composition, bid-to-cover ratios and average interest rate: Joint Economic Committee Monthly Debt Update, July 8, 2026, drawing on Treasury data.
Prior RIA analysis: Rising Interest Rates: Why The Narrative Fails Against The Data and Treasury Bond Yields Don’t Lie: But Wars Don’t Drive Them.

Comments
Log in or sign up to join the conversation.