
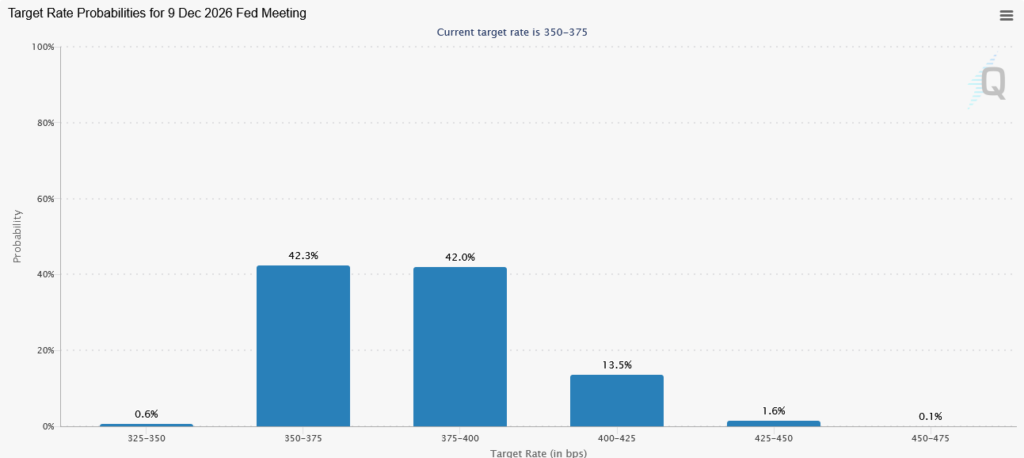
The equity market spent early 2026 with wavering odds of a rate cut before year-end. With improving labor data and high inflation, that assumption is becoming untenable. While the Fed Funds futures and bond markets are now pricing in odds of a rate increase, the equity markets don’t seem to care.
Let’s consider the setup heading into today’s FOMC meeting. May nonfarm payrolls doubled expectations at 172,000, while CPI is over 4%, double the Fed’s 2% target. At the same time, oil prices have fallen but remain elevated. New Fed Chair Kevin Warsh inherits a committee with a known hawkish tilt and little incentive to ease prematurely after the Powell era’s “transitory” miscalculation became a major policy failure.
The June quarterly economic projections (dot plot) will provide new insight. If the median projection shifts to show no cuts in 2026 or even a hike, the market’s second-half bullish thesis could be threatened on three fronts.
Valuations compress. The S&P 500 trades at roughly 22x forward earnings. As rates rise, historically high multiples become harder to justify.
Refinancing stress rises. Corporate America has approximately $1.8 trillion in debt maturing in 2026 and 2027, with additional new debt to fund AI expansion. Higher-for-longer will eat into corporate profits.
The consumer weakens further. Credit card rates above 20%, mortgage rates above 7%, and auto loan rates near 8% are already pressuring the bottom 75% of consumers. No cuts mean no relief for consumers.
The counterargument supportive of bullish trends in equity markets is that earnings growth can offset the pressure. Further, AI-driven productivity and resilient corporate margins may keep the equity markets elevated despite the rate environment. It is a credible argument, but it requires a healthy consumer and continued growth in the labor markets.
The stock market has been remarkably resilient despite war and consumer concerns. The question is whether equity markets are priced for one or more rate increases.
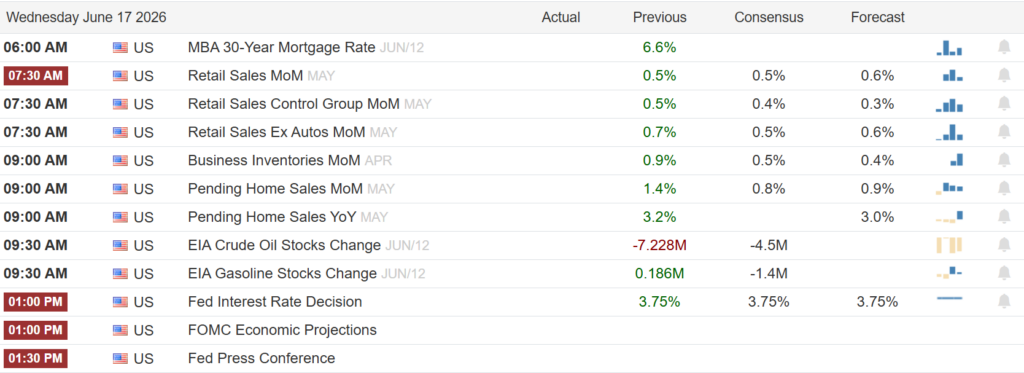
What To Watch Today
Earnings

Economy
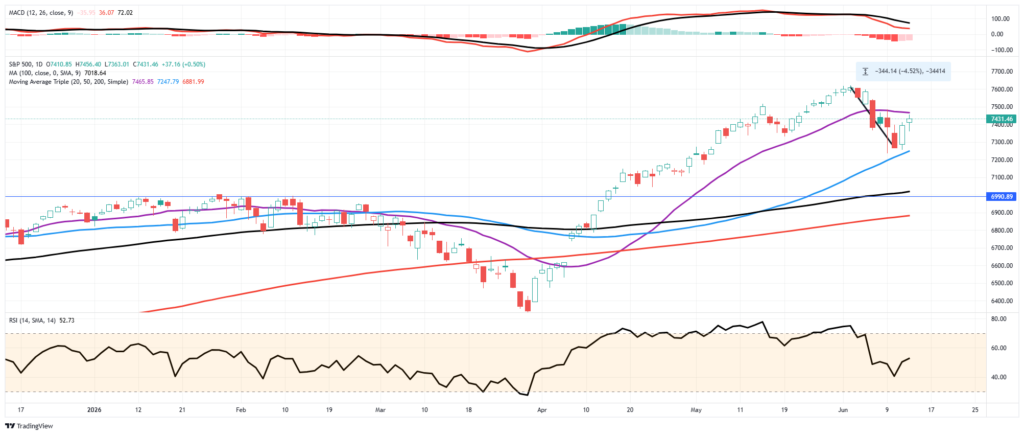
Market Trading Update
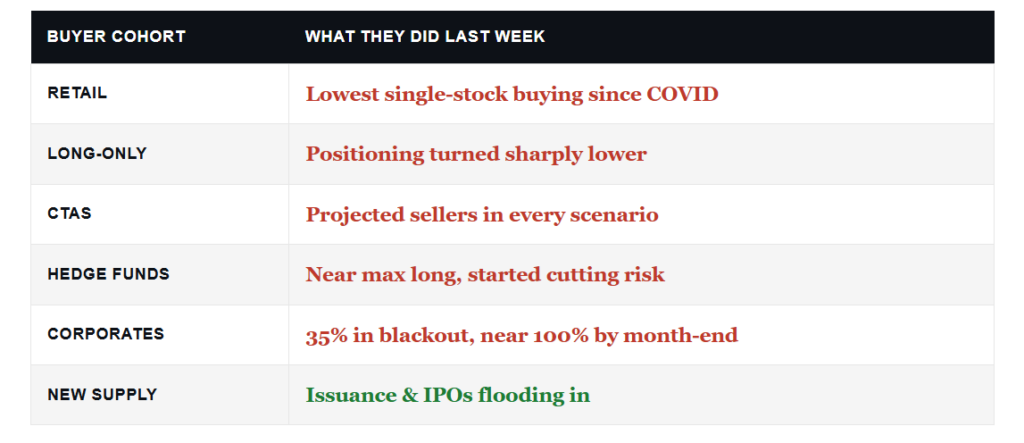
Yesterday, we discussed how the market typically performs following pullbacks that reverse overbought conditions. The interesting question I have received lately is “where is all the liquidity to buy stocks coming from?” Because when I run through the major cohorts of equity investors, almost every one of them is selling or stepping back.
Start with retail. Single-stock net buying just fell to the lowest 3-day pace since COVID, per Kevin Gordon. Strip out the frenzy around the SpaceX IPO that priced June 12, and there wasn’t much left across the rest of the market. The crowd everyone assumes is chasing this tape is barely showing up.
Institutions aren’t filling the gap either. Deutsche Bank’s positioning gauge turned sharply lower last week, driven mostly by long-only selling. CTAs? Goldman projects them as sellers in EVERY scenario over the coming week. Hedge funds sit near max long, with prime-book gross leverage at 317.8%, the 92nd percentile of the past year, yet they started cutting risk last week too. Even tech, the “can do no wrong” trade, saw modest selling led by fresh shorts.
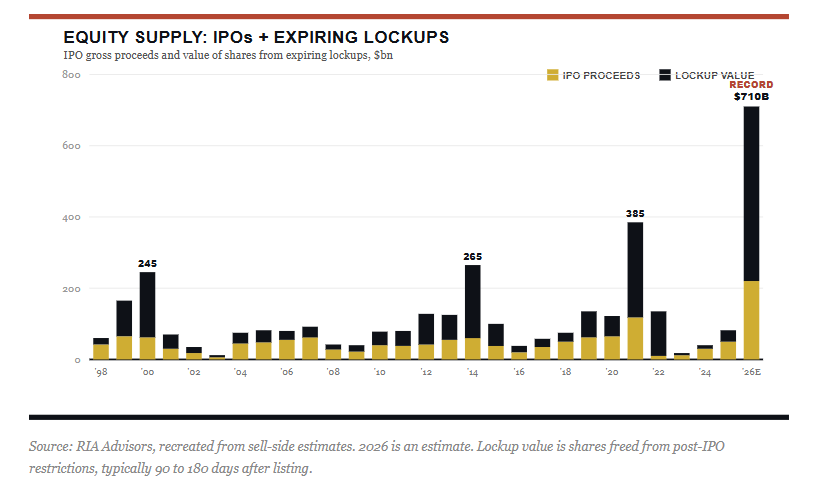
Then there’s the corporate bid, the most reliable buyer of the past decade. Roughly 35% of companies are already in buyback blackout, and that climbs toward 100% by month-end. The supply side looks worse. About 160 firms have lined up over $120 billion in IPOs this year, more than the prior two years combined.
I don’t know the answer with certainty, and neither does anyone selling you a tidy story. Maybe foreign money is filling the void. Maybe pensions are reallocating. Maybe a handful of mega-caps are simply carrying the whole tape. Flow analysis is inherently incomplete, and for every seller, there must be a buyer. Still, the conclusion is hard to dodge. The buyers everyone counts on are NOT the ones bidding this market to records.
What does history say? Near term, this can keep running. Bob Farrell’s Rule #4 reminds us that exuberant markets usually travel further than you think before they break. A momentum tape fed by passive flows and fresh index inclusion doesn’t need committed buyers to grind higher. Longer term, the 1999 issuance comparison is the line I’d circle in red. When supply floods in at the second-richest valuation in the index’s 69-year history, forward returns have rarely been kind to the people who bought the last 10%.
Here’s the takeaway for your own portfolio. Don’t fight the trend, but don’t mistake a melt-up for a foundation. This is the moment to rebalance, trim your winners back to target weight, lift overall quality, and keep some dry powder for the volatility that always follows a one-sided tape. Capital preservation comes first. We can always buy back in. We can’t always recover a loss we didn’t have to take.
Oil Prices Kick Off A Disinflationary Trend
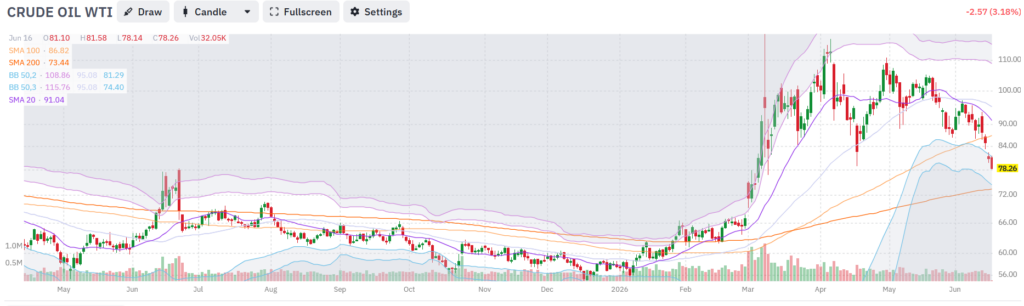
Over the last month or two, we have been making the case that the inflation story was an oil story, and that when the Strait of Hormuz opened, and oil prices fell, inflation would follow. As we share below, oil is now down below $80 a barrel and trending lower.
The chain reaction linking oil prices and inflation from here is mechanical. The BLS measures gasoline prices during the first three weeks of the reference month. The recent sharp decline in oil prices will flow directly into the June CPI report, released on July 15. At current CPI weights, the nearly 20% decline in gasoline prices since mid-May should reduce the CPI by 0.70%. In turn, albeit with a lag, the prices of other goods and services reliant on energy will normalize.
The bond market is sensing a change in inflationary expectations. Five-year inflation expectations are back to 2.50%, the same level that persisted before the war started. Yields declined across the curve Monday and Tuesday as the inflation risk premium embedded in Treasuries began to deflate alongside oil prices. The full relief won’t show up in the inflation data for months, but the bond market will price in expectations that, assuming peace holds, high inflation will abate. In our opinion, the question is no longer whether the disinflationary trade plays out. It is how much will impact bond yields.
Tweet of the Day

Comments
Log in or sign up to join the conversation.