
The April Employment release confirmed continued growth in total and private employment. My observations: some modest downward revisions, and some sectoral trends diverge.
Figure 1 depicts the estimates by vintages for the past five releases. In general, the revisions are downward.
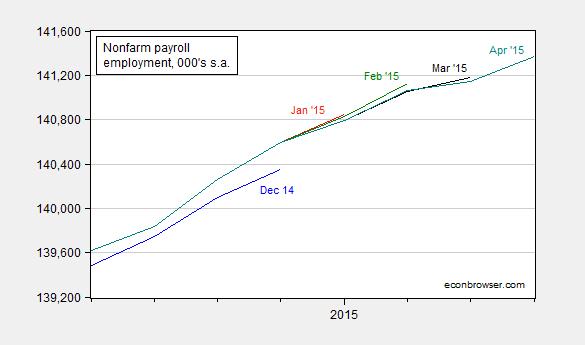
Figure 1: Nonfarm payroll employment, 000’s, seasonally adjusted, from December 2014 release (blue), January 2015 (red), February 2015 (green), March 2015 (black), and April 2015 (teal).
Source: BLS various releases via FRED.
Next, it’s of interest to examine the trends in two sectors that have faced headwinds: oil and gas extraction and manufacturing. The former has definitely declined, but back to levels seen in March 2014. (Obviously, this series does not include effects on ancillary activities, including construction.). The latter has flattened out.
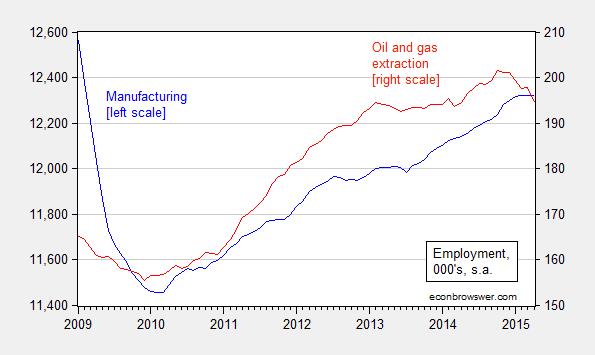
Figure 2: Employment in manufacturing (blue, left scale), and in oil and gas extraction (red, right scale).
Source: BLS April release via FRED.
Since employment in manufacturing exhibits an overall downward trend over time due to above-economy-wide average productivity growth, it’s useful to compare to manufacturing production. Figure 3 confirms that output has also flattened out, likely due in important part to the effect of the dollar’s appreciation (see this post).
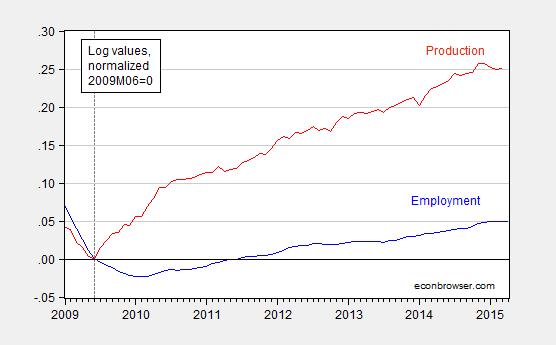
Figure 3: Log manufacturing employment (blue) and log manufacturing production (red), both seasonally adjusted, and normalized to 2009M06=0.
Source: BLS April release and Federal Reserve, both via FRED, and author’s calculations.


Comments
Log in or sign up to join the conversation.