


In this technical article we’re going to look at the Elliott Wave charts of Apple Stock (AAPL) published in members area of the website. As our members know, we have been calling for a pullback in the stock. As expected, the correction unfolded in a clear three-wave structure before buyers stepped back in. In this discussion, we will break down the Elliott Wave forecast.
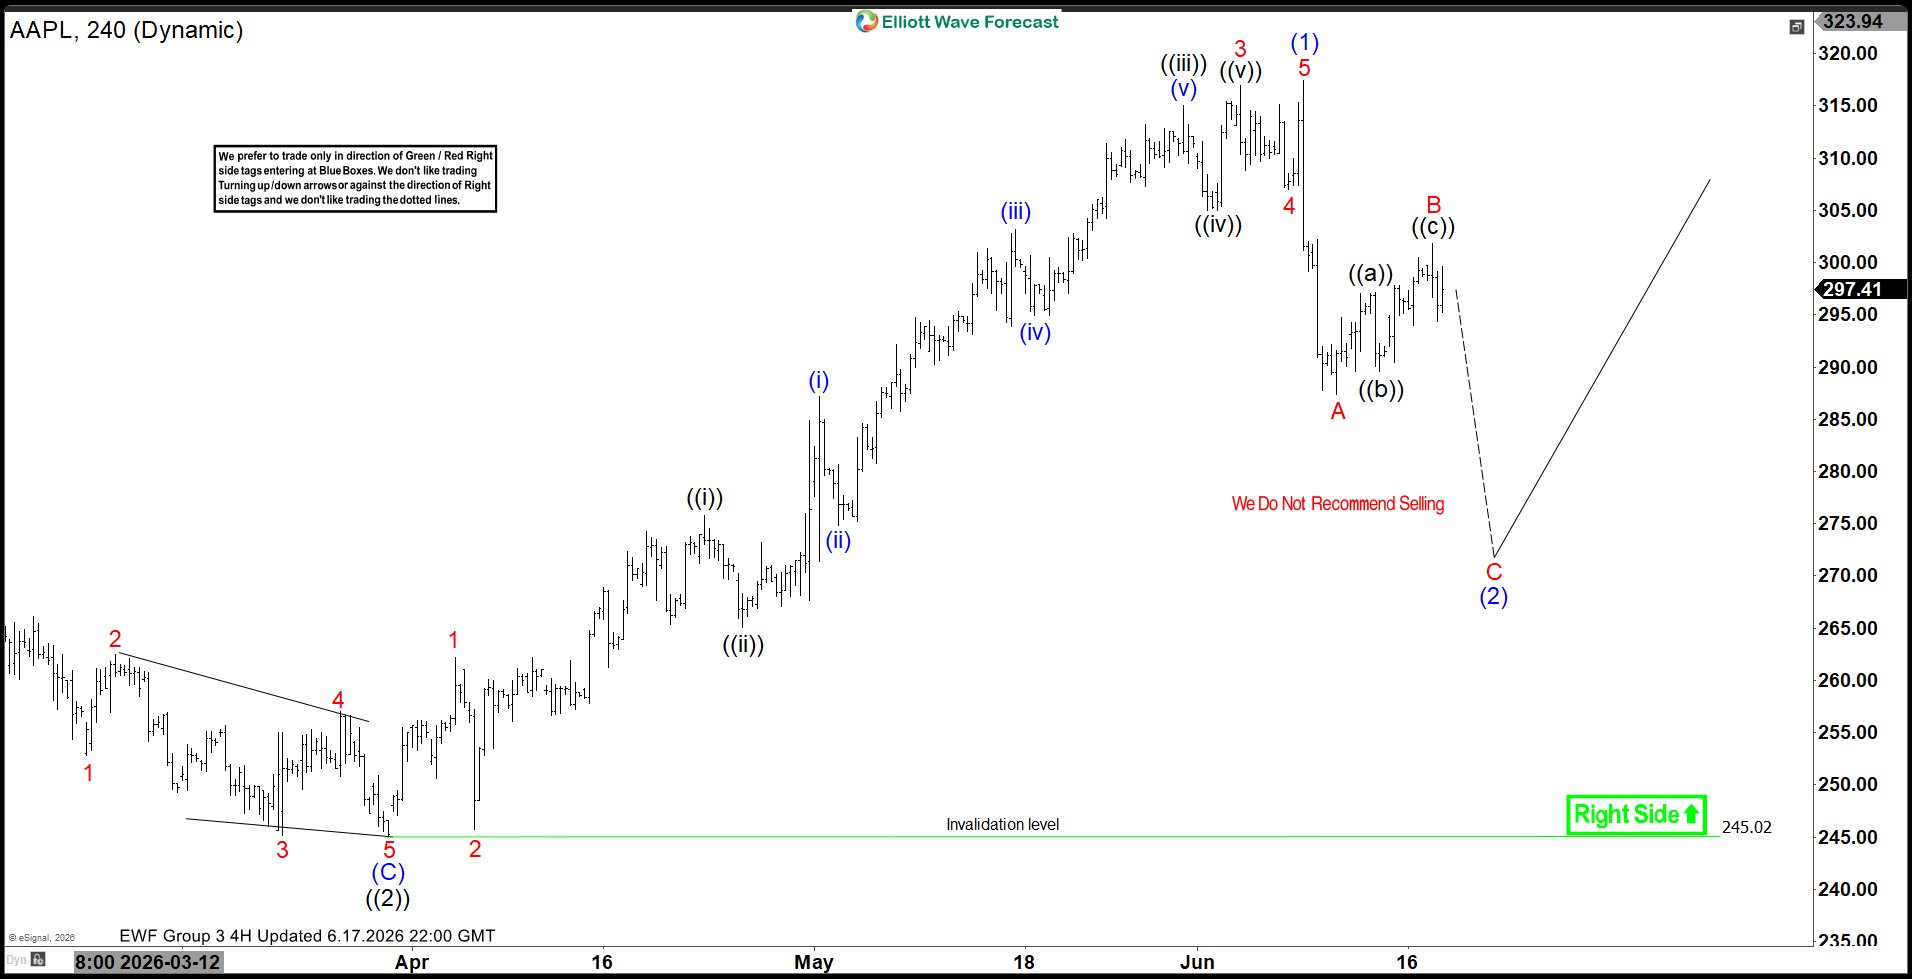
AAPL Elliott Wave 4 Hour Chart 06.17.2026
The current view suggests that AAPL stock has started a new bullish cycle. The stock completed the cycle from the 245 low as an impulsive five-wave structure, which is a bullish confirmation.
As markets rarely move in a single direction, a three-wave correction typically follows a five-wave advance, providing an opportunity to join the trend. At this stage, we can see a sharp decline from the peak, which appears to be unfolding in a five-wave structure, suggesting that another leg lower is still needed.
So far, we have seen only the first leg of the Wave (2) correction, marked as A (red). A three-wave bounce in B (red) has also developed. While price remains below the current short-term high, Wave C (red) should ideally be in play, targeting the 272.4–265.3 area (buying zone).
As Elliott Wave practitioners and our members know, these reversal zones are typically identified by measuring the equal legs area (1.00–1.236 Fibonacci extension of A relative to B), using the Fibonacci extension tool.
Did you know ? 90% of traders fail because they don’t understand market patterns. Are you in the top 10%? Test yourself with this advanced Elliott Wave Test
Official trading strategy on How to trade 3, 7, or 11 swing and equal leg is explained in details in Educational Video, available for members viewing inside the membership area.
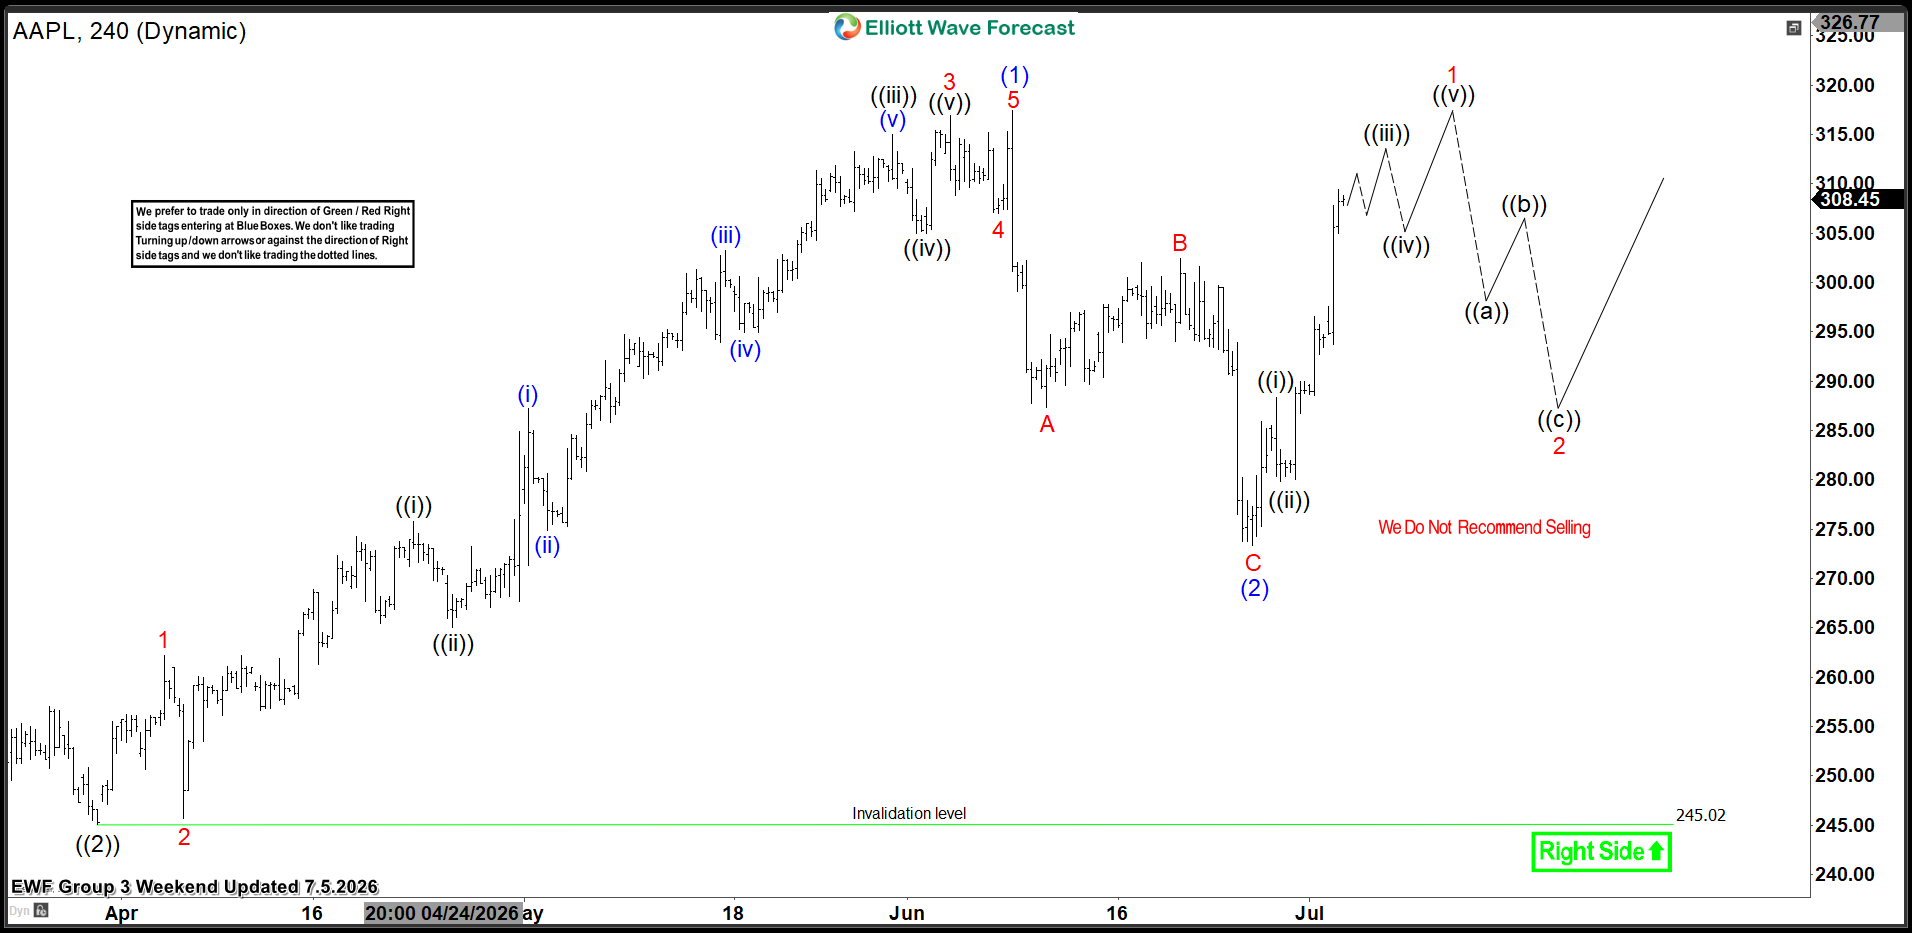
AAPL Elliott Wave 4 Hour Chart 06.17.2026
The stock has made another leg down in Wave C (red) and completed the correction. Unfortunately, it missed our buying zone by a few points and completed the correction slightly above our entry level. This time, the market left us without the trade.It is important to mention that when we miss the optimal entry, we avoid entering in the middle of the move. Instead, we wait for a new setup to develop. At this stage, we would like to see a break above the Wave (1) blue peak to confirm a further bullish extension. Once this breakout occurs, we will look for another three-wave pullback before considering new buying opportunities.
Keep in mind that the market is dynamic, and the proposed view may have changed in the meantime. Our member chat rooms are open 24/7 and provide ongoing expert guidance on market trends and Elliott Wave analysis. Members are encouraged to ask questions about market structure and technical setups at any time.



Comments
Log in or sign up to join the conversation.