

Apple Inc. (AAPL) generated strong free cash flow (FCF) growth and a high FCF margin in its fiscal Q3 results. Moreover, analysts' revenue forecasts are higher, implying higher FCF over the next 12 months. AAPL stock could still be somewhat undervalued after Friday's tumble, as this article will show.
However, a better play than buying AAPL stock is to short one-month out-of-the-money (OTM) puts. This article will delve into that play.
AAPL was down 7.35% on Friday, July 31, to $308.91, following its July 30 earnings release after the market close. AAPL peaked at $340.08 on July 28. However, it's still up from a recent trough price of $275.15 on June 25.
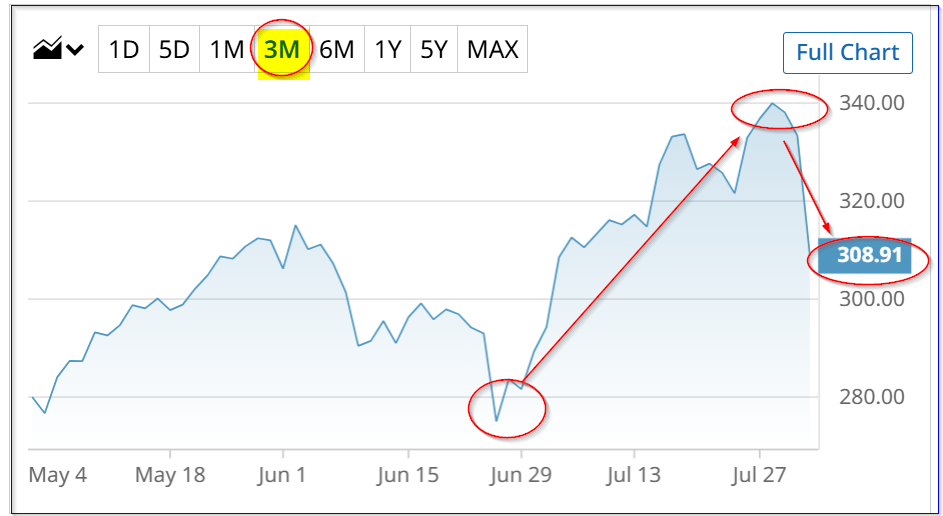
AAPL stock - last 3 months - Barchart July 31, 2026
Apple had strong FCF margins, higher on both a quarterly and trailing 12-month (TTM) basis. As a result, AAPL stock could be worth $345.36 per share next year, +12%.
Strong FCF Growth and Margins
Revenue was up 16.36% YoY in Apple's fiscal Q3 ending June 27 ($109.4 billion), and on a TTM basis, it rose 14.2% to $466.8 billion, according to Stock Analysis data.
Moreover, despite higher capex, FCF grew 30.77% to $31.9 billion, and its TTM FCF rose 42.1% to $136.68 billion.
As a result, its FCF margins were high at 29.17% and 29.28%, respectively (Stock Analysis data). This augurs well for its ongoing FCF forecasts.
For example, operating cash flow (OCF) rose 23.3% YoY in Q3, but its capex fell below last year. Nevertheless, compared to prior Q2 levels, it was up 24.6%, whereas OCF rose just 19.7%.
That restrained level of capex growth could allow Apple to continue to generate strong FCF margins. That could lead to a higher valuation for AAPL shares.
Forecasting FCF
For example, analysts now project revenue for the year ending Sept. 2027 will be $524.8 billion (up 9.9% from $477.4 billion projected for this fiscal year ending Sept. 2026).
As a result, if Apple can maintain at least a 29% FCF margin, despite higher capex, FCF could rise over $152 billion:
$524.8 billion x 0.29 = $152.19 billion FCF
That is 11.3% higher than the $136.68 billion it made in the past 12 months (see above).
Fair Market Value (FMV) and Price Targets (PTs)
That implies that Apple's fair market value (FMV), using a 3.0% FCF yield metric, is over $5 trillion:
$152.19b / 0.03 = $5,073 billion (i.e., $5.07 trillion)
That compares with its market cap today of $4.537 trillion. (This is based on 14.61 billion shares outstanding and today's price of $308.91 per share).
Apple's FMV is 11.8% higher than today's market value. That means the price target is:
$308.91 x 1.118 = $345.36 per share PT (i.e., +11.8% upside)
Analysts agree AAPL is undervalued. For example, Yahoo! Finance reports that the average of 46 analysts is $321.66 per share. Barchart's mean survey PT is $322.32 and AnaChart's survey of 29 analysts is $316.31.
The average of these three surveys is $320.10, or +3.6% upside, and my analysis shows it's about 12% too cheap. So, the bottom line is that despite today's tumble, AAPL stock looks somewhat undervalued
However, this upside is not that great. AAPL could keep falling.
As a result, for some investors it makes sense to set a lower potential buy-in point and get paid while waiting. This can be done by shorting out-of-the-money (OTM) AAPL puts in nearby expiry periods.
Shorting One-Month AAPL OTM Puts
For example, the Sept. 4 options expiration chain shows that an investor can earn a 1.15% one-month yield. This is if the investor agrees to buy AAPL at $290.00, or over 6% lower than Friday's close. Here is how that works.
The option chain below shows that the $290.00 put option contract has a midpoint premium of $3.33. That implies that a short-seller (i.e., agreeing to buy 100 shares at $290, or $29,000) can immediately receive $333 in their account. That works out to 1.15% for one month (i.e., $333/$29,000).
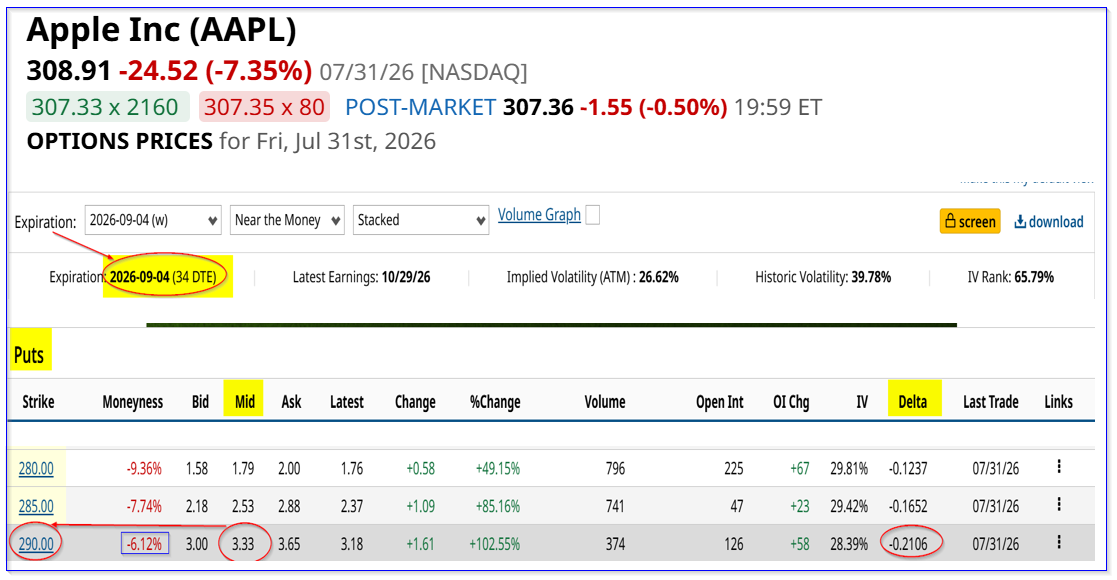
AAPL puts expiring Sept. 4 - Barchart - As of July 31, 2026
The investor has to post $29,000 in collateral with their brokerage firm. Then, after entering an order to “Sell to Open” 1 put at $290 expiring Sept. 4, the account earns $333.
That put also has a delta ratio of just -0.21, implying just a 21% probability that AAPL could drop to $290 by Sept. 4. If this happens, the account will be assigned to buy 100 shares, i.e., the $29K collateral will be exercised.
But, in that case, the investor's actual breakeven price is $290-$3.33, or just $286.67, -7.2% below Friday's close. That provides some good downside protection.
Moreover, if the investor can repeat this play each month for six months, the expected return is 6.9% (i.e., 1.15% x 6). That's equal to the midpoint return from buying AAPL shares.
But, at least the investor will have a higher potential upside if the account is assigned (i.e., $345.36/$286.67 = 1.205 -1 = +20.5% upside.
That shows why some investors are willing to short one-month OTM puts to set a lower potential buy-in point in AAPL stock.


Comments
Log in or sign up to join the conversation.