


Image Source: Pexels
Including “Liberation Day” and “termination”, down 15%, and 7.9% (log terms) relative to post-inauguration peaks (through 4/22 close).
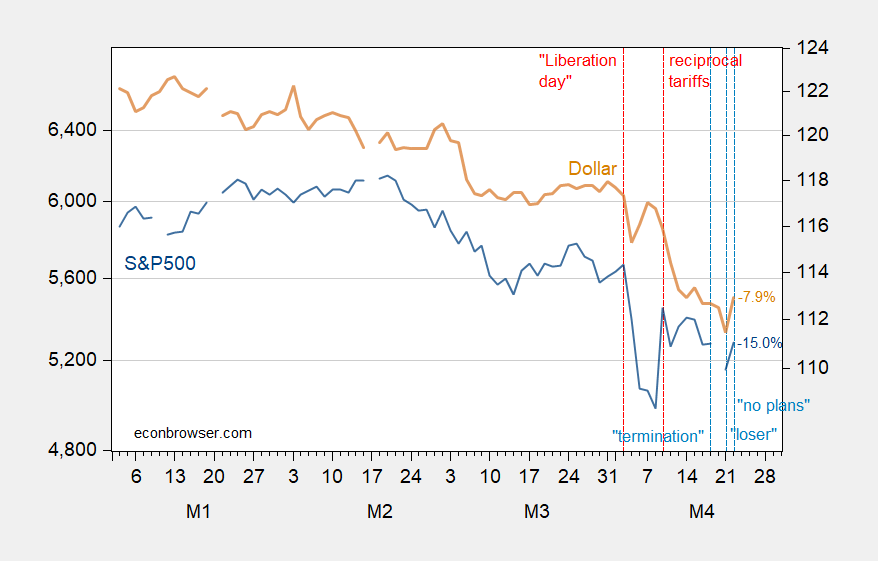
Figure 1: S&P500 (blue, left log scale), and nominal dollar against advanced country currencies (tan, right log scale). Last two days of dollar use dxy spliced to Fed measure. Source: FRED.
More By This Author:
IMF, WSJ Forecasts for 2025 U.S. Growth Revised DownDollar Dominance No More?
2025Q1 Stall Speed? Tracking And Betting On GDP Growth, Retail Sales Composition



Comments
Log in or sign up to join the conversation.