

- Potential flat correction can send Dogecoin to 0.13 area
- Elornd looks for support at 90 level
- MIOTA can visit 1.0 area
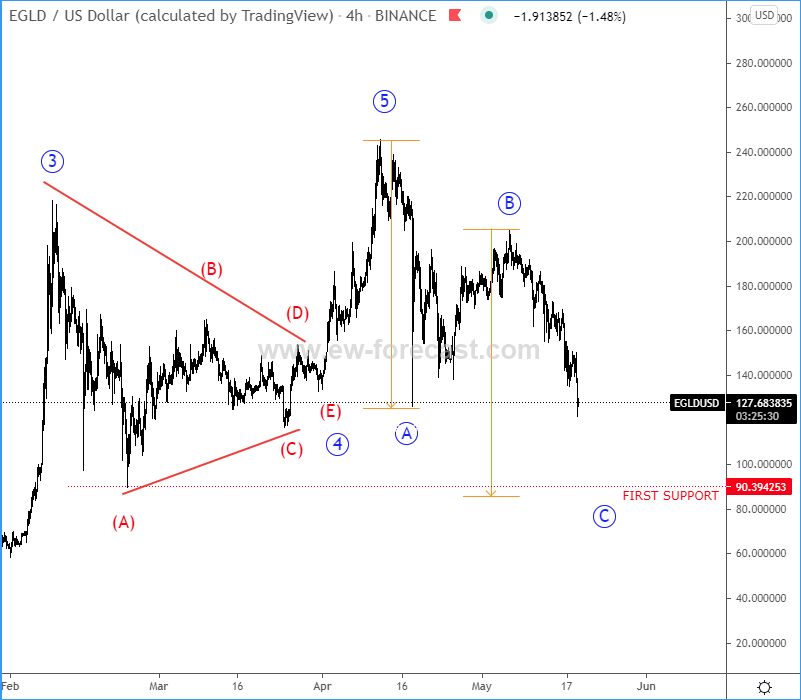
EGLD/USD is ideally trading within an A-B-C Elliott Wave correction after a completed 5th wave, so more weakness can be seen within wave C, probably towards the projected first 90 support area, then we will see if down there will be any bounce and recovery.
EGLDUSD 4h Elliott Wave Analysis Chart
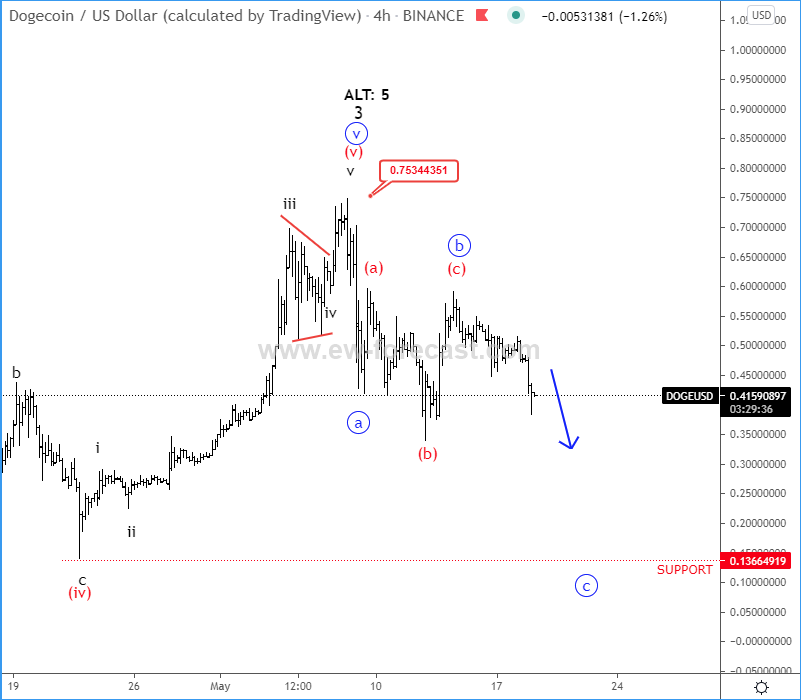
DOGEUSD is turning down after we noticed a potential flat correction(corrective Elliott Wave pattern) in wave »b«, so seems like wave »c« can be now in play which can send the price even down to the projected 0.13 support area.
DOGEUSD 4h Elliott Wave Analysis Chart
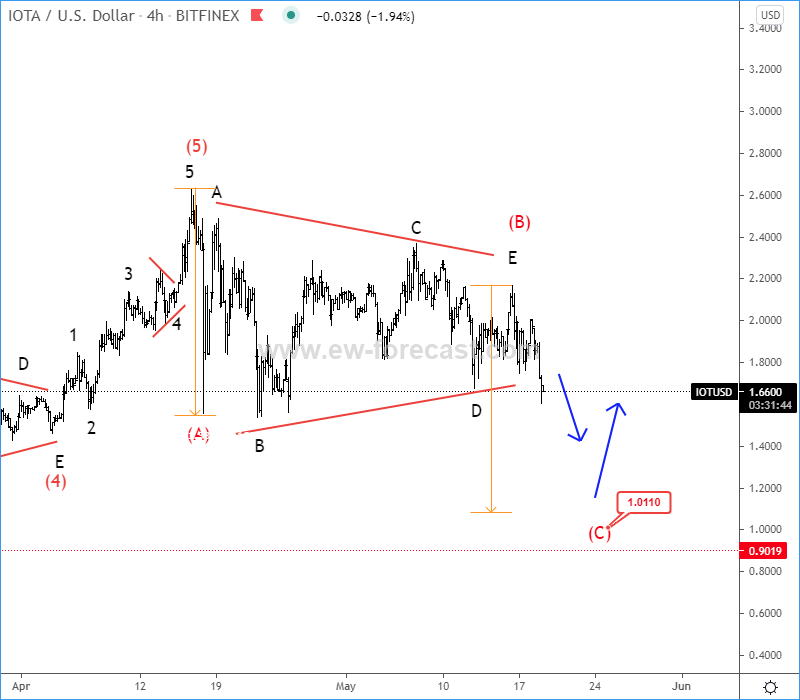
IOT/USD is trading as expected and looks like bearish triangle within wave (B) can be completed, so watch out for that wave (C) decline which can send the price even down to 1.0 support area before bulls show up again.
IOTUSD 4h Elliott Wave Analysis Chart



Comments
Log in or sign up to join the conversation.