
Starting this morning, Alphabet will replace Verizon Communications in the Dow Jones Industrial Average. The index change hasn’t gotten much media attention, but it sends a loud message about the economy. The change makes Alphabet one of just 30 companies that Dow Jones & Company deems representative of the US industrial landscape. Verizon, which was once a cornerstone of the American infrastructure, is no longer worthy of such esteem in the opinion of Dow Jones & Company.
The Dow’s composition has always been a lagging indicator of where economic power resides. For example, they added Apple in 2015, long after the iPhone and smartphones had reshaped the economy. It also added Goldman Sachs in 2013, after the financial crisis had already demonstrated the financial sector’s systemic importance. Simply, the index’s composition lags economic reality.
But the Verizon-to-Alphabet swap is worth considering for what it says about the earnings trajectory. From 2023 through today, information technology, including Alphabet, has contributed significantly to the outsized gains in broader market indexes such as the S&P 500. Investor enthusiasm for growth, particularly AI, drove multiple expansions. Verizon, meanwhile, has become a value stock offering respectable dividend yields but little in the way of earnings and revenue growth. As we share below, its earnings growth has been essentially flat for a decade and pales in comparison to Alphabet’s.
Furthermore, the inclusion of Alphabet in the Dow reflects the shift of corporate earnings power from physical to digital infrastructure. The composition of the Dow is not a leading indicator of business trends. But when it finally catches up to where earnings power has moved, it tends to confirm what the market already knows. The AI economy is not coming; It is already here.

What To Watch Today
Earnings
No notable earnings releases today.
Economy

Market Trading Update
Let’s anchor the picture in the actual tape. The S&P 500 closed the week at 7,306, which put it about 0.7% below its 50-day moving average near 7,360. That’s the first close beneath the 50-day since the rally off the April low, and it matters as a signal even though the distance is small. The index still sits roughly 5.6% above its rising 200-day average near 6,921, so the larger uptrend is intact. This stock market pullback has pushed the index down about 4.1% from the June 2 record high of 7,620.
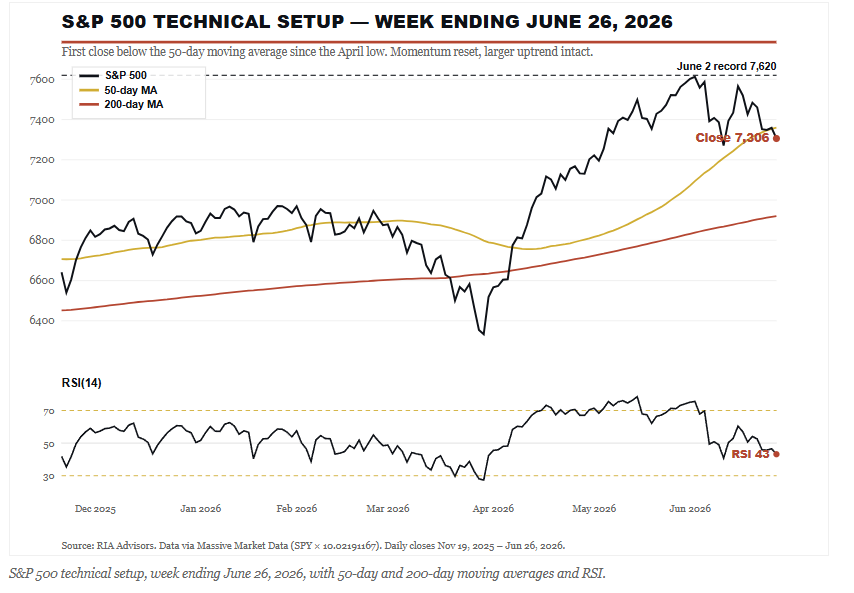
Momentum has cooled, not collapsed. The 14-day RSI sits in the low 40s, down from readings above 75 at the start of June, which is exactly the kind of reset a stretched, overbought market needs before it can push higher again. The MACD has rolled over below its signal line with the histogram widening to the downside, so the short-term trend points lower. That’s a caution flag for traders, not a reason for long-term investors to abandon ship.
Here’s where it gets interesting. Breadth improved while the index fell. The equal-weight S&P beat the cap-weight by more than two and a half points on the week, one of the widest gaps in favor of the average stock we’ve seen in months. Going into this pullback, only about 58% of S&P members traded above their own 50-day average, well short of the 70% to 80% you want to see in a healthy advance. A rotation that lifts the laggards is precisely how that number repairs itself.
In the ETF Sector Rotation Model, we didn’t chase the most extended winners. We trimmed our most stretched technology exposure back toward target weight earlier this month, added to defensive positions, and let the cash buffer ride. That posture did its job this week while the crowded names took the hit.
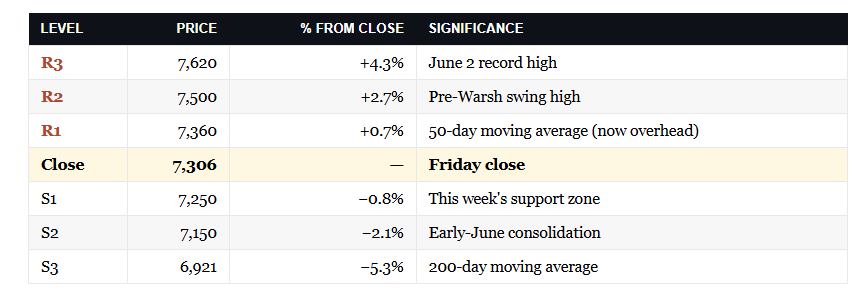
The level that matters most in the new month is that 50-day average near 7,360. A weekly close back above it keeps the uptrend humming and sets up a retest of 7,500 and then the 7,620 record. A decisive break below 7,250, this week’s support zone, opens the door toward 7,150 and, if the selling accelerates, the 200-day moving average near 6,921. Manage risk at the line, not after it breaks.
Trade accordingly.
The Week Ahead
The key headlines this week may likely come from Fed Chair Warsh’s speech this Wednesday. We suspect he will maintain the hawkish tone the market perceived at the last FOMC meeting, but he may not confirm the market’s expectations that the Fed could hike rates multiple times over the next six months. Also, during this holiday-shortened week, the BLS will release its employment report on Thursday. Expectations are for a gain of 112k jobs, well below last month’s 172k. Given that the last revision to GDP shows near-zero growth in personal consumption, all eyes will focus on the means for employees to spend- hours worked and wage growth.
Index rebalancing is having a big impact on trading and will continue to do so through the first few days of July. Pension funds, endowments, and institutional managers that benchmark against major indexes must realign their holdings to match their target allocations. Essentially, this entails selling what has outperformed and buying what has lagged. Given the stark differences in performance between different sectors, this quarter-end could see an amplified impact. Caution is warranted as these flows can be reversed to some degree in the new month.
Friedman Was Right, Just Mostly Misquoted
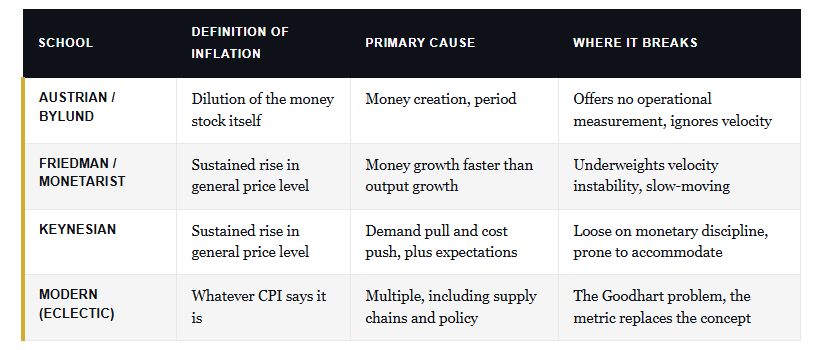
Per Bylund recently wrote a sharp piece for The Daily Economy arguing that CPI and GDP have become Goodhart’s Law in action. When a measure becomes a target, it ceases to be a useful measure. He has a point, and we’ll come back to it. But the bigger problem with the inflation conversation isn’t really about CPI. It’s about the way the famous Milton Friedman inflation quote gets weaponized by people who almost certainly haven’t read past the comma.
The line you always hear is, “Inflation is always and everywhere a monetary phenomenon.” Full stop. Print money, get inflation, or corporations cause inflation. Then, the doomers grab a chart of M2 and a warning about hyperinflation.
That’s not what Friedman actually said.
The complete sentence is,
“Inflation is always and everywhere a monetary phenomenon in the sense that it is and can be produced only by a more rapid increase in the quantity of money than in output.”
That trailing clause changes everything.
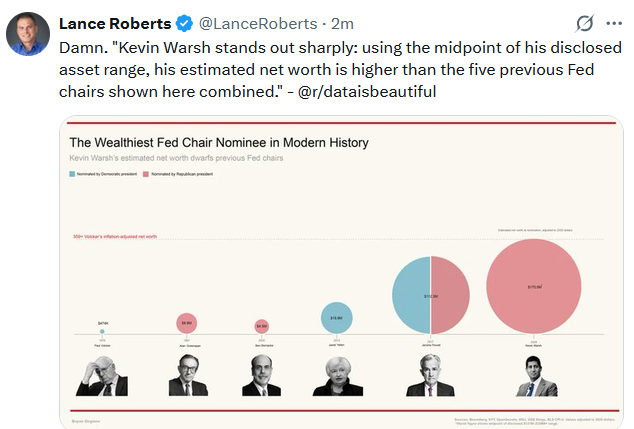
Tweet of the Day


Comments
Log in or sign up to join the conversation.