

Hello everyone. In today’s article, we will look at the past performance of the 1H Hour Elliott Wave chart of Advanced Micro Devices, Inc. ($AMD). The rally from 1.11.2024 low at $143.77 unfolded as 5 waves impulse. So, we expected the pullback to unfold in 3 swings and find buyers again. We will explain the structure & forecast below:
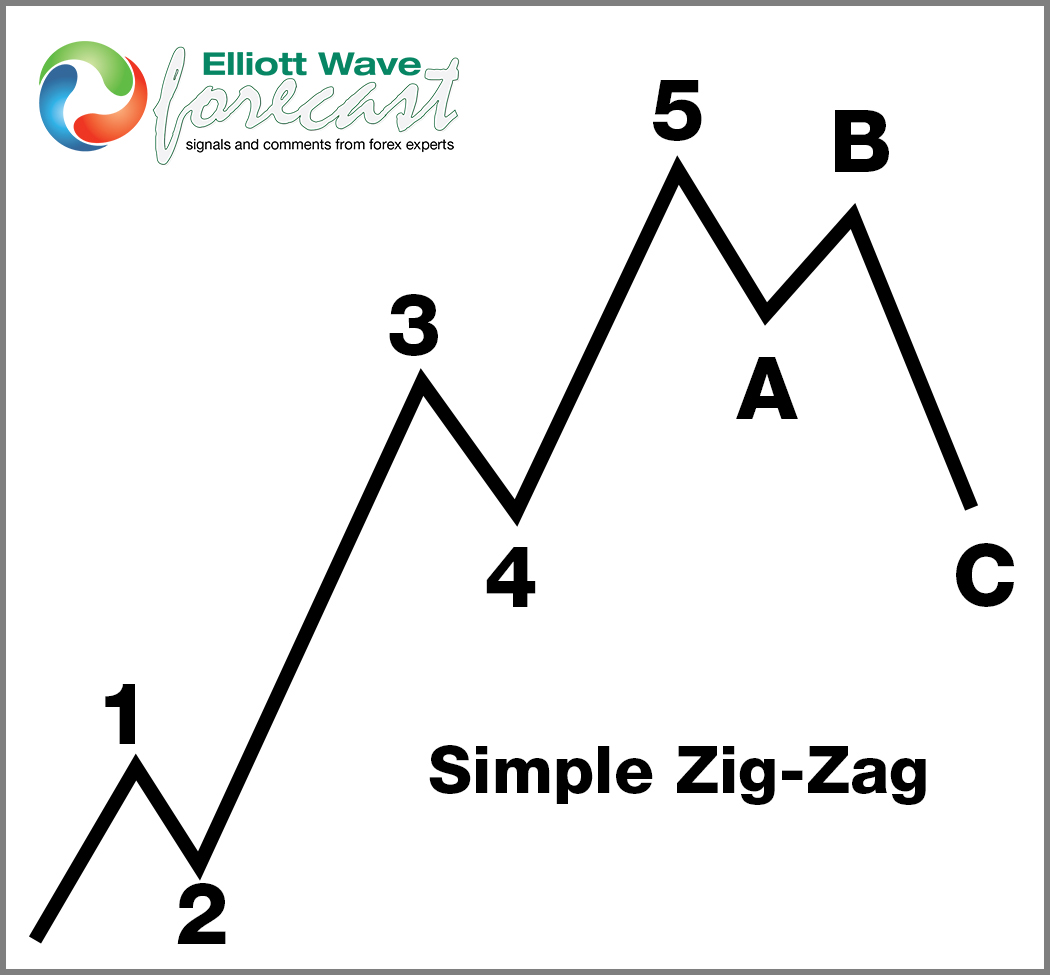
Zigzag (ABC) Corrective Structure
$AMD 1H Elliott Wave Chart 1.26.2024:
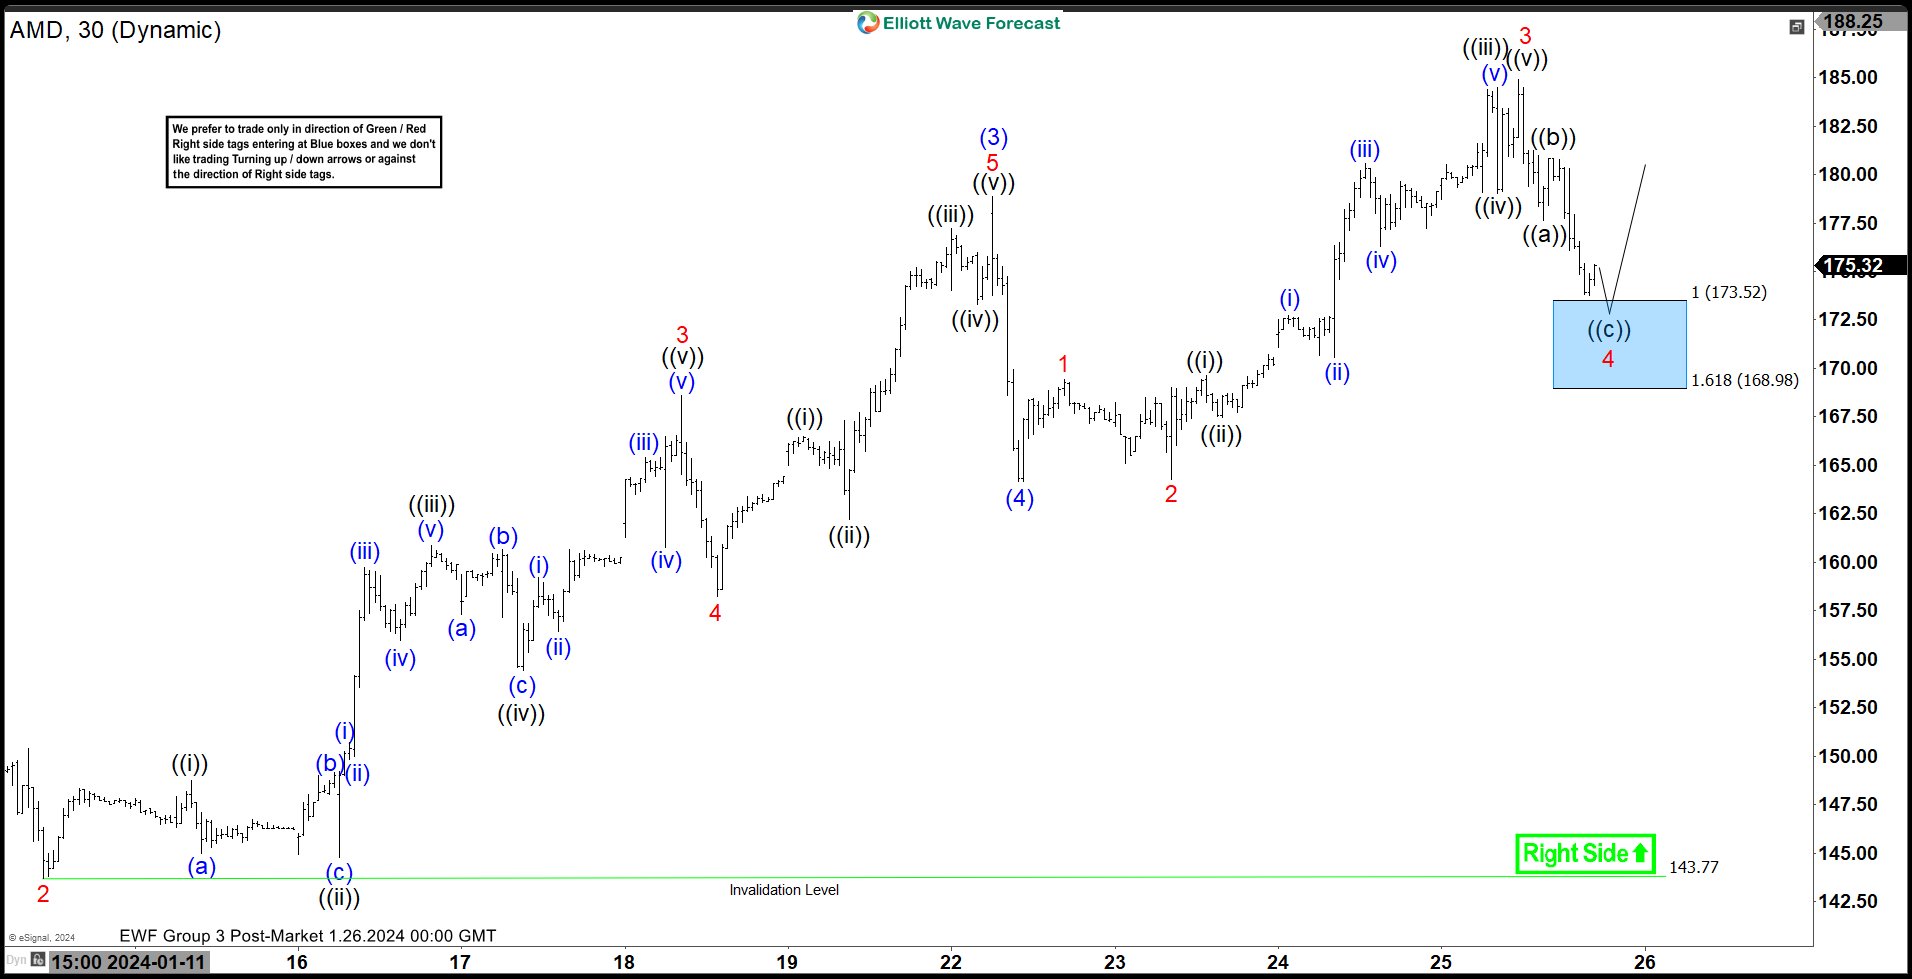 Here is the 1H Elliott Wave count from 1.26.2024. We expected the pullback to find buyers at the blue box area at 173.52 - 168.98 in a 3 swing structure (ABC).
$AMD 1H Elliott Wave Chart 1.28.2024:
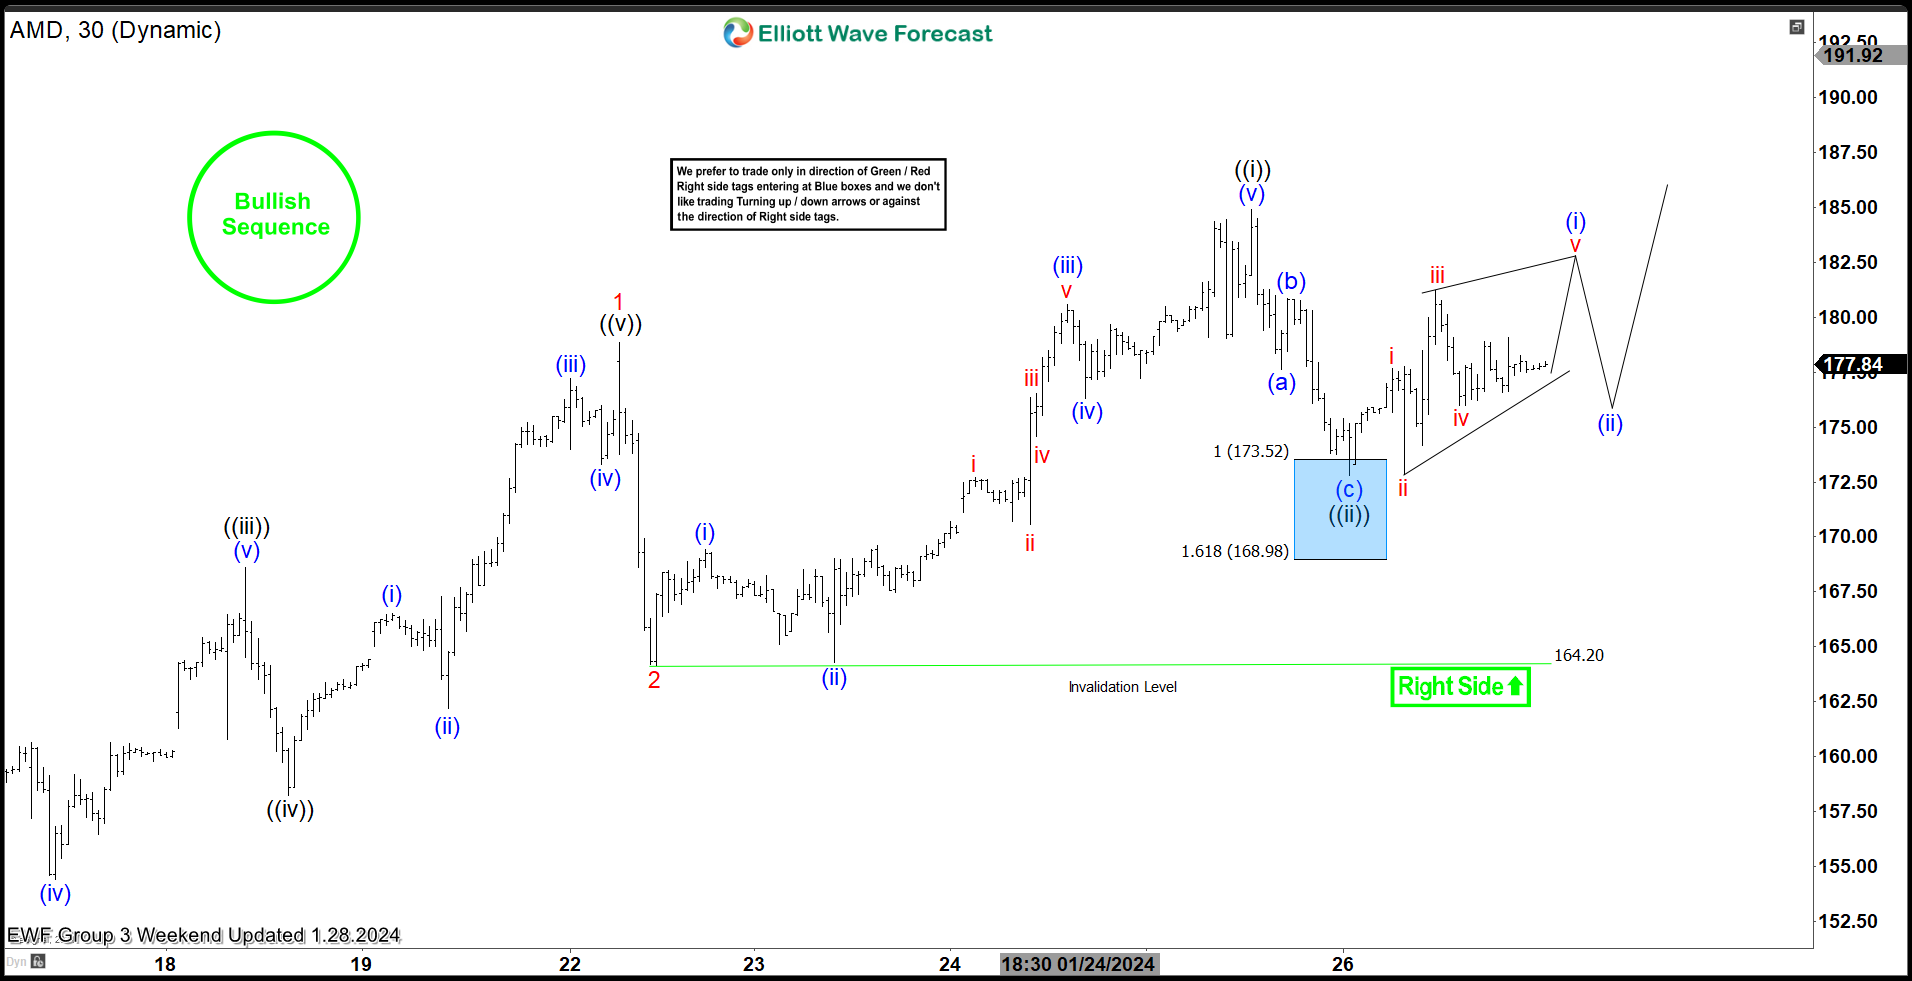 Here is the 1H update 2 days later from 1.28.2024 showing the bounce taking place as expected. The stock reacted higher from the blue box after doing a Zigzag correction allowing longs to get a risk free position.



Comments
Log in or sign up to join the conversation.