
Nonfarm payroll employment clocks in substantially above consensus (Bloomberg: mean 230,000, range 140,000 to 275,000), solidifying trend growth. Previous months’ estimates revised upward. Wages continue to rise, but labor costs in productivity adjusted terms are stable.
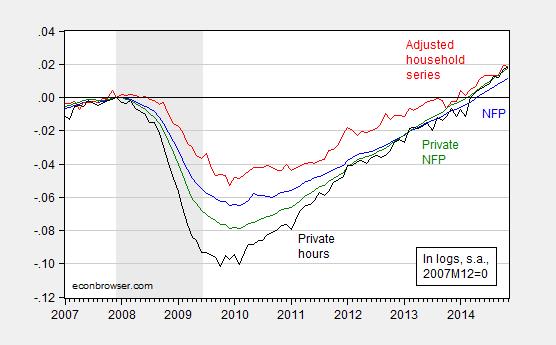
Figure 1: Log nonfarm payroll employment as estimated by the BLS in the establishment survey (blue), and as estimated by the BLS in the household survey, adjusted to conform to the NFP concept (red), and private nonfarm payroll employment as estimated by the BLS in the establishment survey (green), and index of average weekly hours for production and nonsupervisory workers as estimated by the BLS in the establishment survey (black), all seasonally adjusted by the BLS, normalized by the author to 2007M12=0. Recession dates as estimated and defined by the NBER Business Cycle Dating Committee shaded gray. Source: BLS via FRED, BLS, NBER, and author’s calculations.
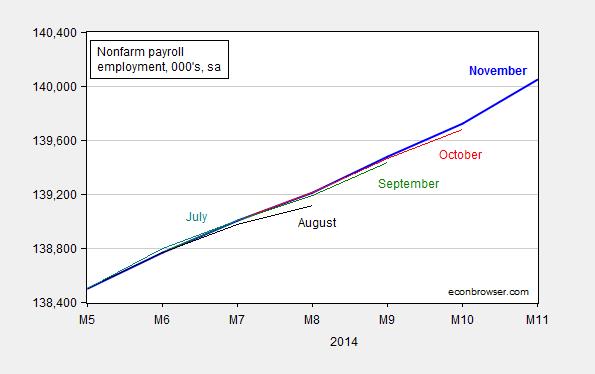
Figure 2: Nonfarm payroll employment as estimated by the BLS in the establishment survey November release (blue), October (red), September (green), August (black), and July (teal). Source: BLS via FRED.
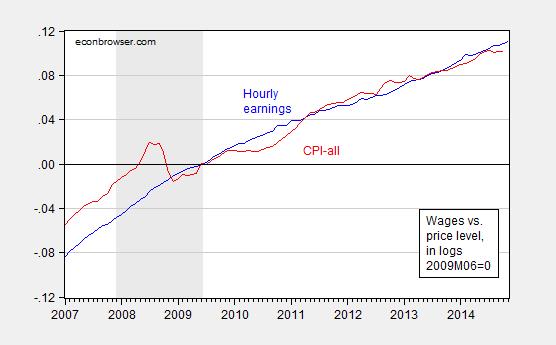
Figure 3: Log average hourly earnings for production and nonsupervisory employees, as estimated by the BLS in the establishment survey November release, and log CPI-all (red), both normalized to 2009M06=0. Recession dates as estimated and defined by the NBER Business Cycle Dating Committee shaded gray. Source: BLS via FRED, NBER and author’s calculations.
While hourly pay appears to be rising faster than the CPI-all (including energy and food), it’s important to recall that inflationary pressures from the labor sector will only manifest in overall price inflation only if (i) unit labor costs also increase, and/or (ii) inflationary expectations become unanchored (of which there is little evidence thus far). Figure 4, derived from the costs and productivity release (revision released a couple days ago) indicates little upward pressure — see the green line below.
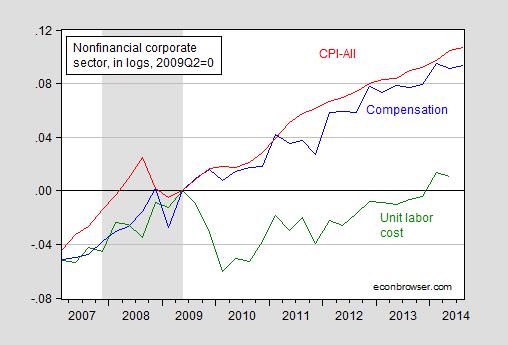
Figure 4: Log estimated compensation for nonfinancial corporations (blue), estimated CPI-all, quarterly average of monthly data (red), and estimated unit labor cost index for nonfinancial corporations (green), all normalized to 2009Q2=0. Recession dates as estimated and defined by the NBER Business Cycle Dating Committee shaded gray. Source: BLS, and BEA via FRED, NBER, and author’s calculations.
Note that unit labor costs are now only 1.1% higher than the previous peak in 2009Q2 (in log terms). I mention this because of the comments by Joint Economic Committee Chair Brady (R) on the employment release:
“This month’s report is good news for American workers,” Brady said. “As the job market improves, the Federal Reserve must begin to normalize monetary policy.”
“In the 1970s, Washington policymakers relied on the Fed’s easy money to compensate for anti-growth tax and regulatory policies. The result was double-digit inflation,” Brady said.
The Chair makes no reference to inflationary expectations, trends in realized inflation, and the trajectory of energy prices (which differ quite markedly from those in the 1970’s). But then, Chairman Brady has a penchant for warning about inflation when none is in sight [1], [2].
See discussion by Furman/CEA, Stone/CBPP, McBride/CR (1), McBride/CR (2), Portlock/WSJ RTE, Zumbrun/WSJ RTE.


Comments
Log in or sign up to join the conversation.