


We’ve been spending most of our writing/research time on the AI bubble - and yes it’s a bubble - with good reason. The AI buildout is, in financial terms, the biggest thing ever. Period. Rewinding to the 1990s, the Internet backbone buildout, undersea cable placement and related activities, along with bringing the Internet to people’s homes was, at that time, the biggest thing ever. This dwarfs it.
We compared capital expenditures (CAPEX) and our best guess at the total cost of the Internet buildout and adjusted it to 2009 dollars. 2009 is a good halfway point between the startup phases of the projects. We then looked at the total cost - so far - of the AI buildout, adjusted that to 2009 dollars and it’s already 17X the cost of the Internet buildout. And the AI buildout is not even close to done yet. In fact, given the nature of AI, the project may for all intents and purposes, run in perpetuity.
But this isn’t yet another article about AI and its behemoth costs. It’s about the distortions all the spending is creating in our macroeconomic metrics, particularly GDP. We’ll get to that part about halfway through the article.
Most modern economies use the expenditure methodology for determining GDP (gross domestic product). The formula is:
Y = C + I + G + (x-m)
where Y is total GDP, C is consumption, I is investment, G is government spending, x is exports, and m is imports. The expression (x-m) is the trade balance. If x > m, then there’s a trade surplus. If the opposite is true, then a trade deficit exists. Therefore if (x-m) is positive, it adds to GDP and if it’s negative, it subtracts from GDP. In the US, our trade deficits are legendary.
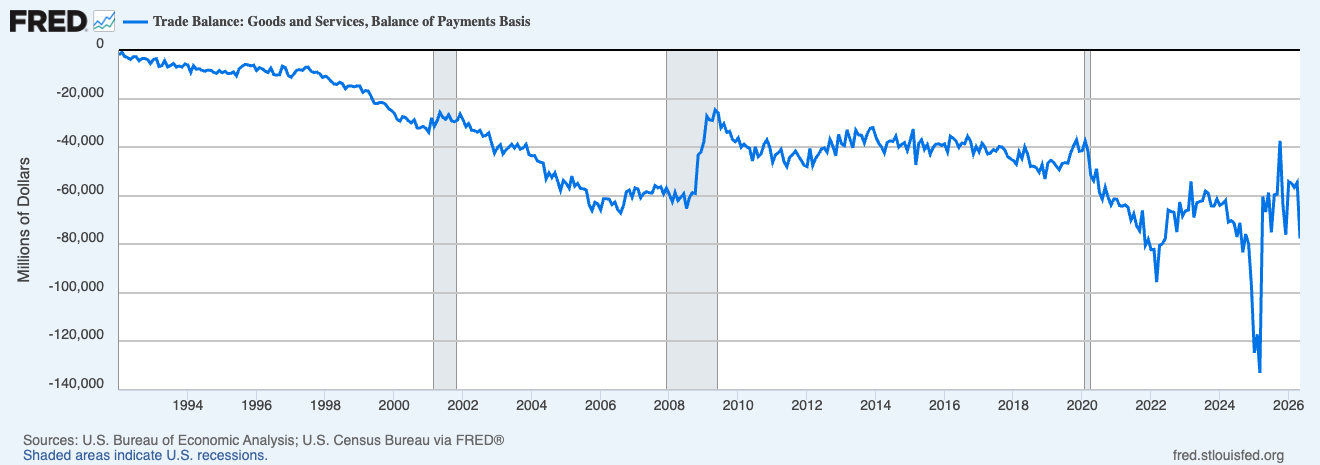
The traditional ‘current account’ metric has been discontinued, but was replaced and is shown below. At the end of 2025, the current account deficit was around 3.6% of GDP.
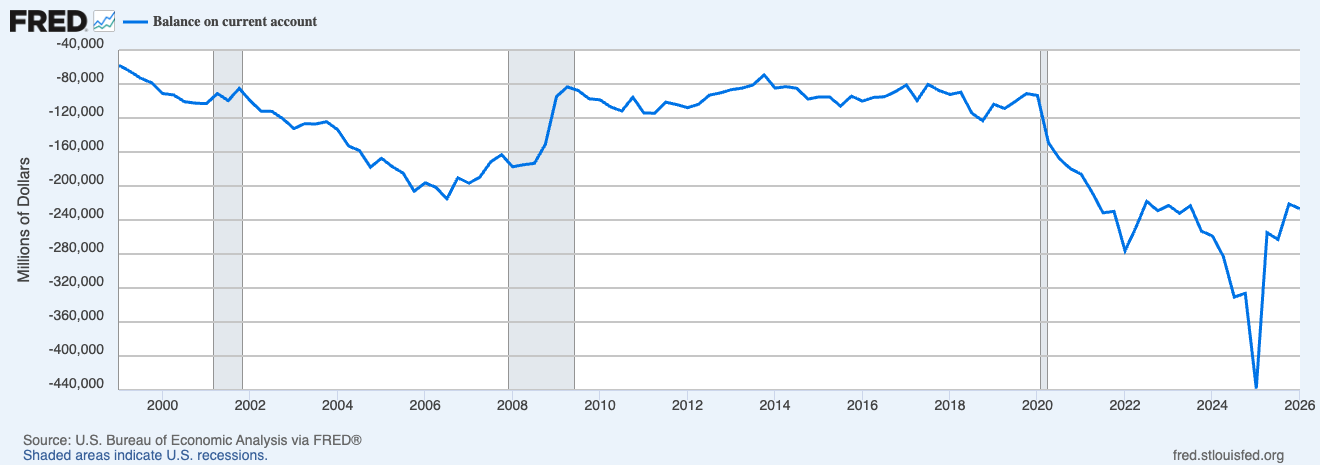
It should be noted on both of the above charts that the volatility last year was mostly caused by rapid adjustments to the USGovt’s tariff regime. The trade deficit widened considerably as importers stacked orders to avoid the increased duties. Both charts are in millions of dollars (for simplicity’s sake, chop the last three zeros off the y axis values and that’s how many billions are represented). Both charts represent seasonally adjusted figures.
There are already some serious issues with the expenditure model.
All measurements are in currency, not units sold. If prices go up and units stay the same, the calculation shows economic growth when all that’s happen are the effects of monetary inflation. The government here in the US uses a GDP ‘deflator’, which is supposed to account for this, but the deflator is historically low - likely intentionally.
The US, like most modern economies is addicted to debt. Hopelessly addicted at this point. Money borrowed and spent into the economy counts as ‘growth’, but there is zero allowance in the numbers that this debt must be repaid. Unless the plan all along has been to stiff our creditors?
The methodology has been changed over the years. All of the changes are biased up - they’re intended to make GDP look better than it might otherwise. We’ll allow that a couple of the changes do actually make sense, particularly R&D spending being counted. R&D leads to new products. While not all R&D dollars are spent on successful projects, obviously, it makes sense to count it. The investment component (I) has recently been receiving attention, mostly due to all the CAPEX being deployed on AI. There are arguments both for and against including this new component of I, however, we note that much of this money is borrowed - see #2 above.
For reference, here’s a breakdown of the major adjustments to GDP since 1991; the year we stopped using GNP and replaced it with GDP:
1991: The US officially switched from using Gross National Product (GNP) to Gross Domestic Product (GDP) as its primary measure of economic production.
1999: A major revision occurred when the Bureau of Economic Analysis (BEA) incorporated computer software into GDP as fixed investment, recognizing its long-term economic value.
2013: The BEA implemented its biggest revision since 1999, applying changes retroactively to 1929. Key methodological updates included:
Reclassifying business and government research and development (R&D) expenditures as fixed investment rather than intermediate costs.
Counting expenditures on entertainment, literary, and artistic originals as fixed investment.
Shifting defined benefit pension plans from a cash basis to an accrual basis to better reflect unfunded liabilities.
Adjusting wages and salaries estimates to use accrual-based methods consistently.
These 2013 changes, driven by the 2008 System of National Accounts guidelines, were designed to account for the shift toward an intellectual property-based economy. The revisions added approximately $500 billion to U.S. real GDP (roughly 3%), with R&D adding over 2% and creative works adding 0.5%. While the absolute size of the economy appeared larger, the underlying trends remained largely unaffected.
So let’s go through a quick breakdown of how AI spending has impacted GDP.
AI spending has been responsible for roughly half of US GDP growth for the previous 4 quarters.
Non-residential CAPEX not connected to AI has dropped by 3% in the past 4 quarters. During the last decade, non-residential CAPEX averaged around 5% growth per year.
Investment in industrial and transportation equipment (again, not related to AI) has dropped 2% over the last 4 quarters.
Manufacturing construction has absolutely COLLAPSED, dropping 20%. In the last year. So much for ‘bringing manufacturing back to the United States’.
In the aggregate, spending not related to AI is running around $130 billion below the 15 year trend line.
Some Additional Notes
The drop in non-AI spending is taking about .4% off GDP growth. Doesn’t sound like a big deal until you consider what $130 billion can do.
The collapse of spending on manufacturing construction is downright alarming. We need to be building new factories. But guys! We’re building all these data centers! Ok, if you want to turn the USEconomy into a roulette wheel, we’re putting all our chips on Red and hoping for a hit.
Don’t forget that very annoying reality fleshed out in the MIT study - 95% of the companies deploying AI for various tasks haven’t made a dime. Of the ones who are, one of the biggest ‘growth’ areas is in something we’re not even going to mention. We’re sure you can figure it out.
Many years ago, we developed an alternative GDP metric based on the Cobb-Douglas production function. We know that no model is going to be perfect. Our model shows that the USEconomy has ‘grown’ just 11% since Q4 of 2006. And Cobb-Douglas isn’t a perfect re-creation since we’re still relying on some Labor Department numbers to run the model. The same Labor Department that creates jobs out of thin air, then quietly revises them away later - and has been doing so for decades.
That said…
Even a modest adjustment of the capital index (an attempt to discount for heavy borrowing that must be repaid) used in our model shows zero growth to recession in all but 5 quarters from Q4 2006 through Q1 2026. A unit-based model would be optimal - and given the technology today - could be done. However, our contention and that of many others is it would show too much of the truth. Don’t forget, fiat monetary systems and the economies that arise from them rely heavily on perceptions and management of expectations.
Fiat monetary systems and the economies that arise from them also rely on credit. This reality is one of the major drivers for our FSO economic model, which takes the pulse of the credit system on a regular basis.
As long as that credit flows, this will continue. We’re not calling the end. There is, however, a point where the credit does dry up even if it’s only because the borrowers cannot make the interest payments - or borrow to make them. Government at all levels is going to require more and more revenue in the form of taxes, fees, levies, surcharges, etc. to make interest payments of its own. This means less for the tax base, less for essentials, less for everything. Then add in the destruction of purchasing power thanks to the not-so-USFed and its policies. 20 years ago, the majority of credit card debt was for luxury and non-essential purchasing: people buying stuff they didn’t need with money they didn’t have.
That script has been flipped. Now, many consumers are using credit cards to buy stuff they DO need with money they still don’t have. Many states, PA being one, are considering massive increases in the minimum wage. This will only make matters worse in the medium and long-run. Plus we begin running the risk of igniting a wage-price spiral.
For our part, we would not be the least bit surprised to see another ‘great deflation’. We get made fun of constantly for bringing this up, but think about the last truly euphoric speculative boom that went across the full spectrum of economic actors - the roaring 20s. Look at what happened.
History doesn’t always repeat but it does rhyme. Another deflationary depression would reboot the system - with a lot of pain. Go look at M2 here in the US. The not-so-USFed deflated substantially after the massive 2019-21 inflationary period. Here’s the kicker - they did a substantial amount of deflation and it really never made it through to consumer prices. It just slowed the rate of growth by a few points. We’re in trouble.
The bottom line - and our point in writing this - don’t just look at the headline GDP numbers and think everything is fine. It never really was fine for the reasons stated above, but now the structural cracks are becoming obvious to even the most casual of observers.



Comments
Log in or sign up to join the conversation.