

This was quite a week, with the market back in a short-term downtrend following a bad signal on Dec. 7. I don't think the bad signal was just a poor interpretation of the charts on my part, I would say so if it were. I think the market really kicked off a new uptrend which quickly failed and is bearish for the larger trend of the market.

The chart below is a closer look at the bad signal on Dec. 7. The new uptrend initially looked healthy with new 52-week lows dropping way down, but that turned out to be a brief pause in the selling which picked up again.

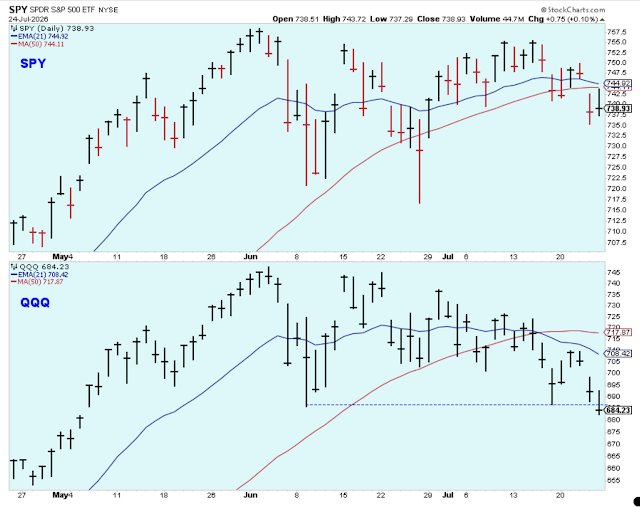
The major indexes are all trading below their 5-day averages, and they are threatening to break down again below short-term support.
Investors.com declared a new "confirmed uptrend" status for the market on Wednesday after interpreting the session as a bullish "follow-through day." However, after so much weakness on Thursday, they said on Friday morning that Wednesday's intraday price lows for the three major indexes are the line in the sand for the market, and that if the indexes violate this level then the market outlook turns negative again.
I see that Investors.com moved the market status back to "market under pressure" after the close, and I'm assuming that next week if there is a close under Wednesday's low, that they will move the market status back to "correction." I agree with this analysis and add extra emphasis to the Nasdaq, which may also break down below its early December lows.

The bullish percents are pointing lower again, although they are already at relatively low levels. I think this is where downtrends become so difficult for traders because the market will have their oversold, sharp, short-covering rallies off the lows that provide confusing market action.

The SPX equal-weight chart pattern could be interpreted bullishly by an optimist because this could be a bull flag or low handle, which is what I was thinking last week. But with so many new 52-week lows, now I'm thinking that it is a lower high in a slow topping pattern.
I will say, though, that the SPX equal-weight looks a lot healthier than I would expect given all the selling and turmoil in the market. I need to keep this in mind as I get so bearish towards stocks.

Here is the chart of the number of new 52-week lows. With this many new lows, you have no choice but to be very cautious about stocks. Simply put, there are way too many new 52-week lows. Bearish.

Regarding the small-caps, a failed breakout was followed by another test of a 12-month support level. In November, this was a bullish chart pattern, but now after the break-out failure, it is a bearish chart pattern. If the market continues to struggle, then it is only a matter of time before this chart breaks down and there could be a substantial move lower.

Here is another look at the small-caps using a weekly chart with a Kaufman moving average. This makes it look like the breakdown has already occurred and with high volume.

One more small-cap chart. This is a monthly chart with a PMO momentum indicator that looks ready to cross lower.

The chart below shows the 10-day call-put ratio at important 2-year support. It turned up on Friday, indicating that the market may not be quite ready to throw in the towel and head lower, at least in the short-term. So this seems to be a bit of short-term bullishness heading into next week.

Bottom line: I'm a bear until the number of new 52-week lows settle down to harmless levels. My accounts are about 25% cash and 20% bear 3x ETFs. I'll be raising even more cash next week if stop levels are reached on the long positions. I can't imagine that I'll be adding to longs, but I will try to remain open to all possibilities.
Outlook Summary
- The short-term trend is down for stock prices as of Nov. 17 (bad signal on Dec. 7).
- The economy is in expansion as of Sept. 19, 2020.
- The medium-term trend is up for treasury bond prices as of Dec. 4, 2021 (prices up, yields down).


Comments
Log in or sign up to join the conversation.