

Traditional Markets
With the issues of big data and a trade and physical war still unresolved, the narrative of the markets at the moment is that fears are easing. The reason for this narrative, of course, is that stocks are going up.
See, many traders, analysts, and especially the media (including myself, but I'm not sure which category I belong to) like to try and look for a connection between the news and markets, even when the correlation isn't that strong. It keeps things interesting at least.
Stocks markets in the United States, Asia, and Europe are all luscious green right now.
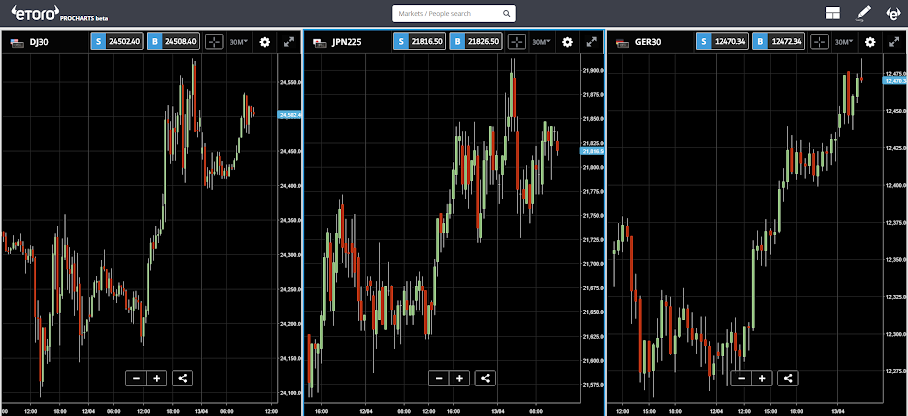
We also have earnings reports coming out today from several big banks and in the wake of Trump's sweeping tax reforms, those numbers will probably be pretty good.
Cut to Japan
The Bank of Japan seems insistent to continue their policy to weaken the Yen.
Recently, they announced that they plan to wind down the current stimulus measures (quantitative easing) for the next five years. This may sound like they're being accommodating but in fact, this is incredibly aggressive.
This comes as people thought that they might be following America's lead and tightening the belt soon.
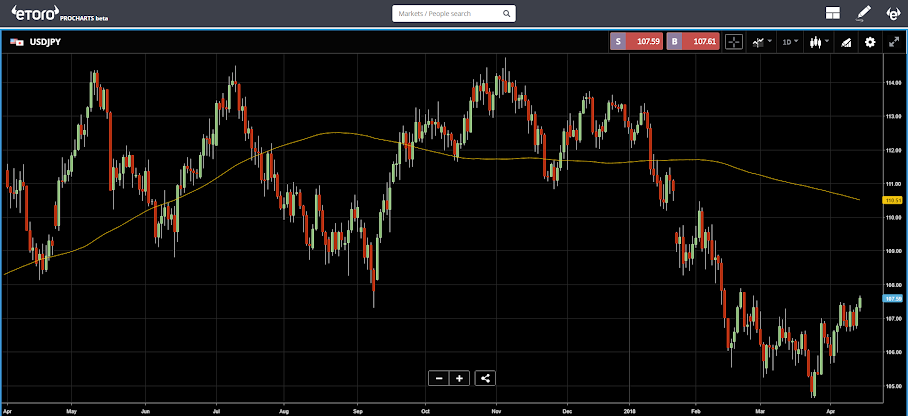
The USDJPY is now back up to where it was in February but still far below the 200 day moving average (yellow).
Bitcoin Charts (Continued from the cover letter)
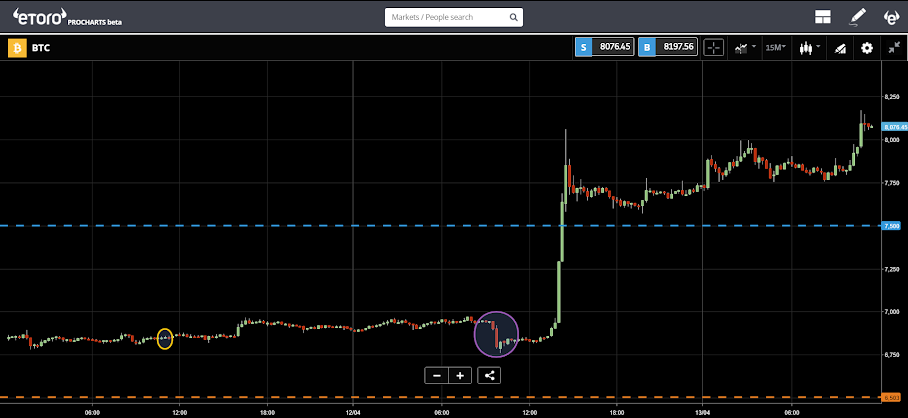
So just quickly, there are two charts here.
This one shows the actual short squeeze playing out. Notice the purple circle. A big ol bear trap that likely caused several people to take out some big shorts on other brokers. eToro sentiment remains bullish as ever.
The yellow circle is when I spoke on Bloomberg. Though I'm pretty sure I had no influence on the market movement, this article seems to be making a connection.
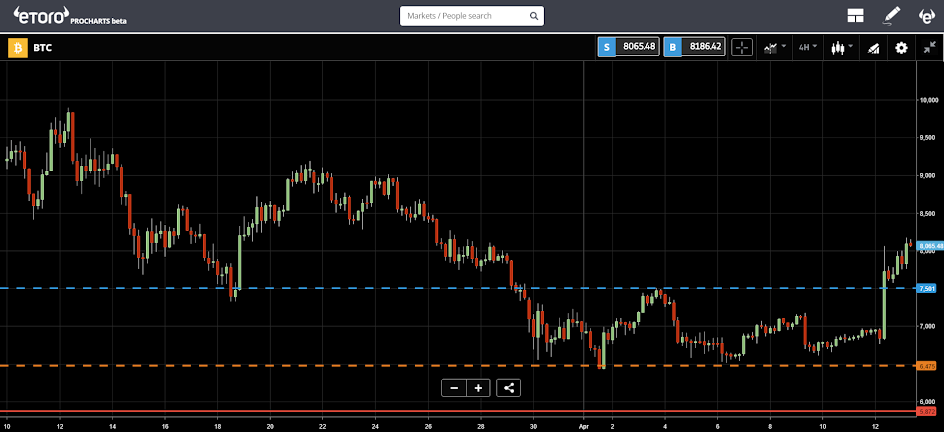
This next graph shows what might be the greater impact on determining the price going forward.
I wanted to be fairly zoomed in here but I did add a red line at the bottom, which is the previous low for February 6th. Certainly, if we were to go below that it would be an extremely bearish sign.
The orange and blue dotted lines represent the tight range (from $6500 to $7500) that bitcoin has been trading in for the past two weeks. Now that we've broken out the top of the range, we would normally look for a test of the blue line before moving forward. However, should the excitement start to come back into this market, it might not need to.
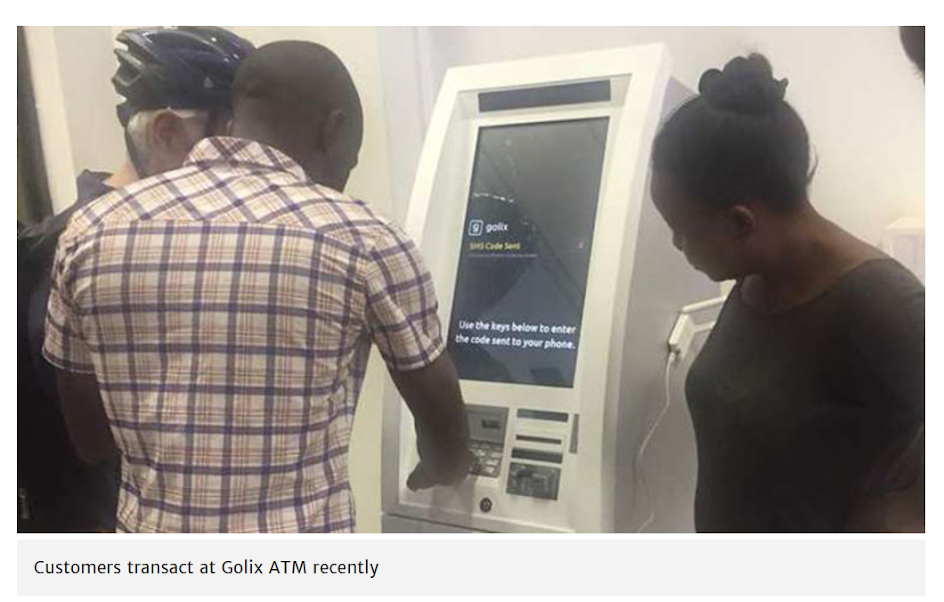
I leave you today with a stunning photo from The Herald, which shows Zimbabwe's very first Bitcoin ATM machine.
Have an awesome day!!!


Comments
Log in or sign up to join the conversation.