


Image Source: AbsolutVision on Unsplash
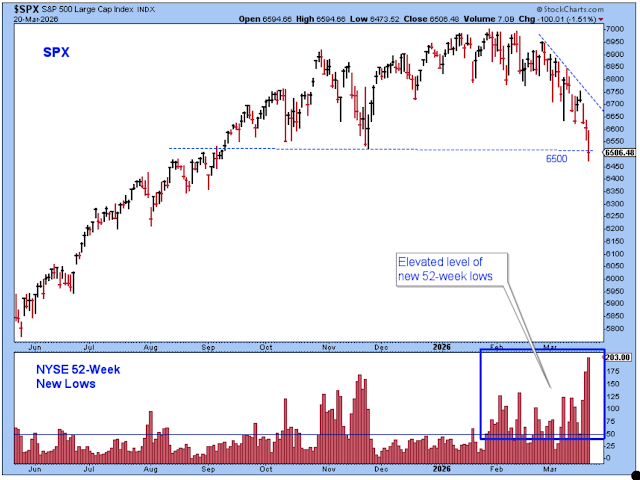
The market started looking wobbly in January. Price volatility picked up, and the number of NYSE new 52-week lows became elevated. So, we all knew the market was on very shaky ground.
Finally, this past week, the SPX tested the 6500-level, which has been on everyone's radar as the critical level of support. There is the possibility that this level will hold, particularly if the news improves, but I'd say that it isn't looking good.
Investors.com has moved to a 100% cash recommendation, and I am reluctantly going to have to follow their advice and sell even the few stocks that are holding up during all this selling pressure.
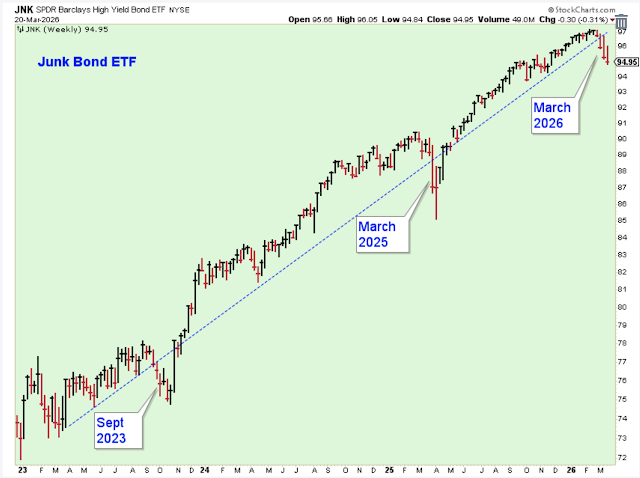
The junk bond ETF is very clearly telling us that it is time for stock investors to move to the sidelines.
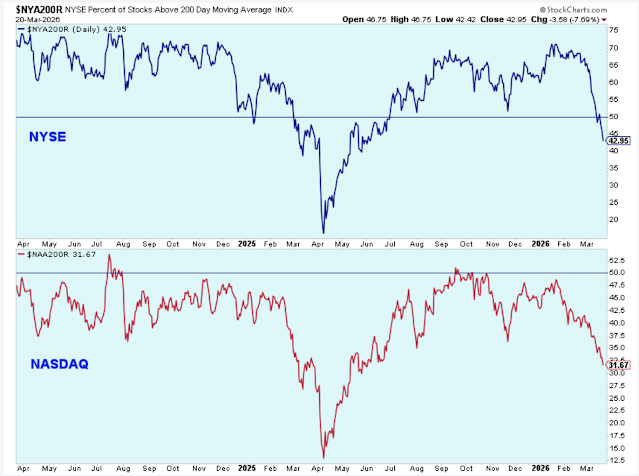
The selling has felt intense and persistent, but, in fact, the number of stocks below their 200-day averages, as shown by the chart below, could still fall quite a bit if you compare its current level to the low level reached during the tariff crisis last April.
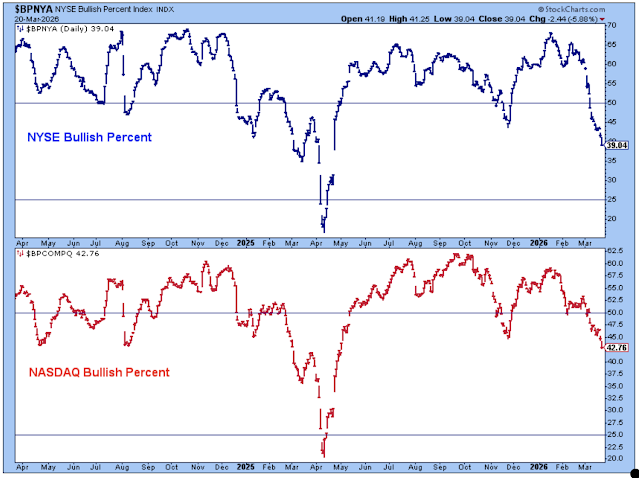
The chart of the bullish percents has a very similar look to the one above. I point this out because people are saying things like, the market is so oversold that it has to start to rally soon. A rally could, of course, happen anytime, but this chart points out that if the current environment is anything like last April, then stocks could fall a lot further.
Finally, the medium-term trend following chart went to a sell signal. It is a bit disappointing that it didn't trigger a signal earlier.
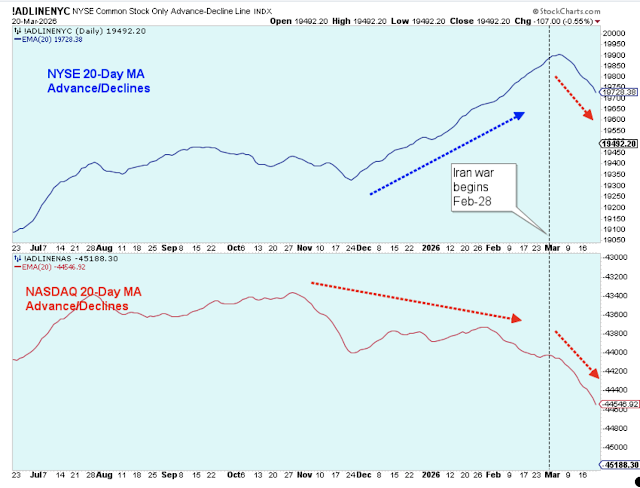
The chart of the advance/decline lines has decisively rolled over. The two major exchanges are now in sync, pointing lower.
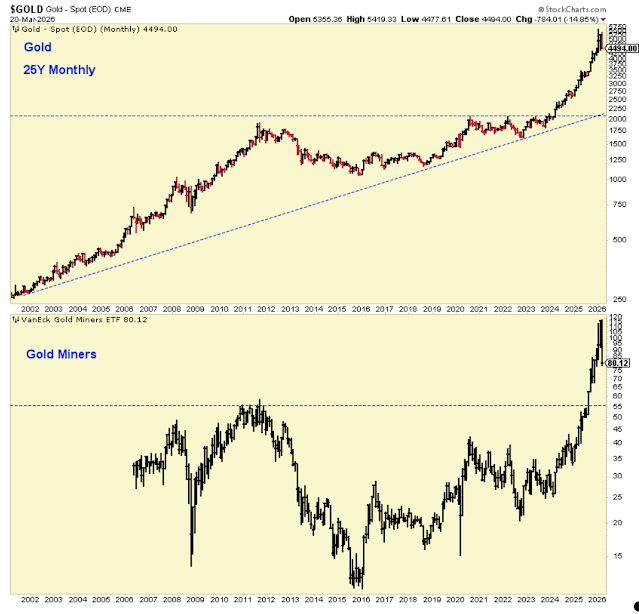
Meanwhile, gold and gold miners have been crushed, but the prices have declined from truly extended levels.
Gold price weakness caught a lot of traders off guard because the assumption was that gold would respond well as inflation fears mounted due to rising oil prices. But after such a huge run-up for gold and gold stocks, traders sold primarily to cover margins and lock in gains.
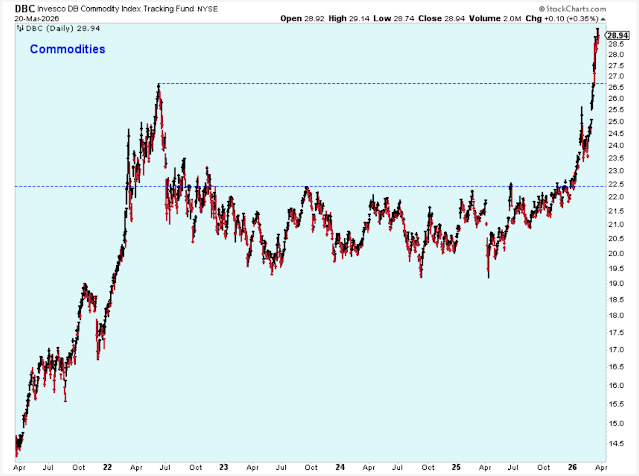
When the Iran war started, oil prices finally joined the other commodities and rallied. The price of this commodity ETF has gone through the roof because oil is by far the most important commodity component.
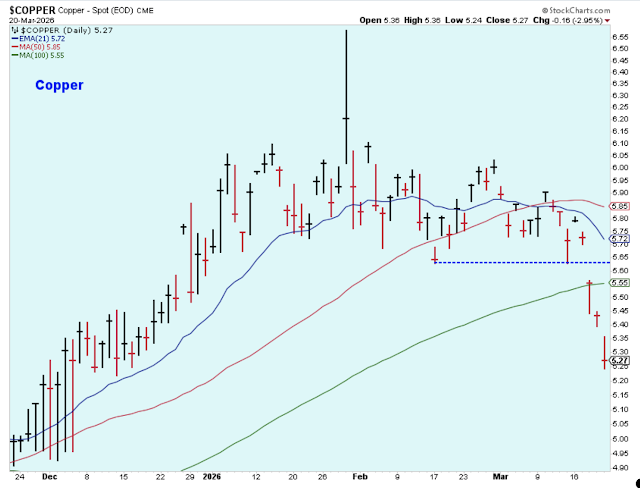
As oil has risen, copper has sold off similar to gold.
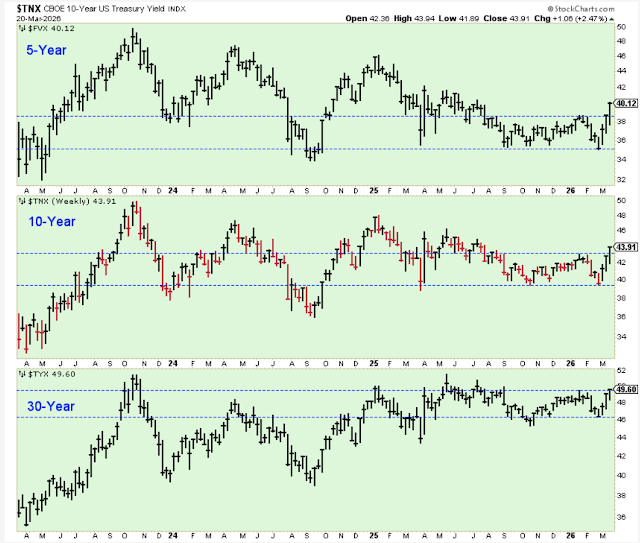
As you can see from the chart below, Treasury yields have gone up since the beginning of March, which means that investors are selling Treasury bonds.
There is a lot of discussion about this because most people, myself included, expected people to buy Treasuries as a safe-haven. Apparently, though, investors are more concerned about inflation, which hurts bond prices, so we see these yields rising.
So, we have gold, copper, Treasuries, junk bonds, and stocks all selling off.
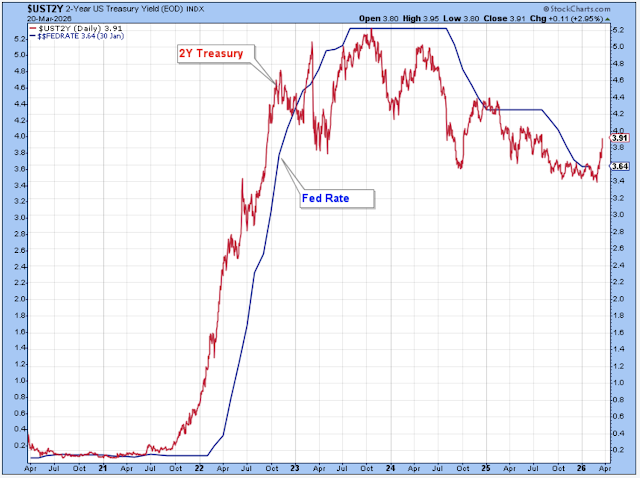
For now, the 2-year Treasury yield is rising and hovering above the level of Fed Funds rates. As a rule, when the 2-year is above Fed Funds, it is usually unlikely that you will see the Federal Reserve cut the Fed Funds rate.
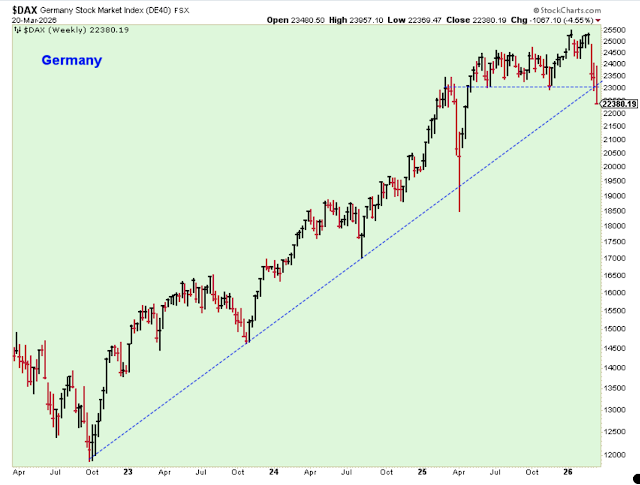
Foreign stock markets have been hit hard by the spike in oil prices, along with the US stock market.
The great debate is whether the spike in oil prices is temporary and whether we should be buying oil-related stocks.
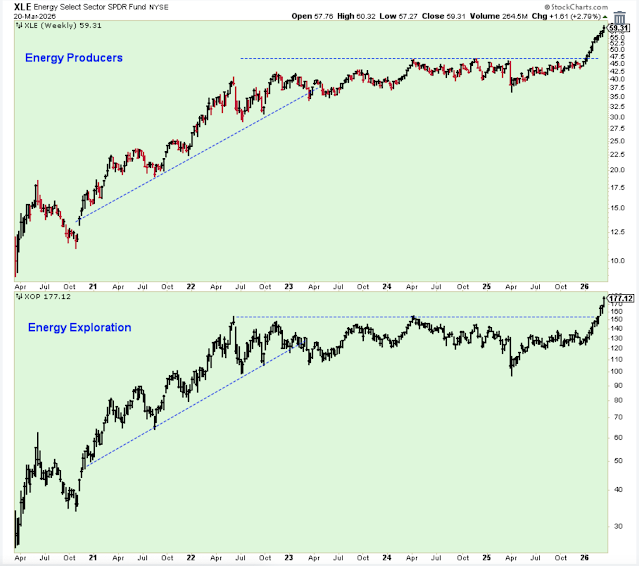
I believe that this chart is showing a dramatic breakout of a multi-year base for energy stocks. For me, the breakouts shown in this chart tell me that in the long-term, these stocks should be owned. But I don't know that I would buy them right now because, stating the obvious, the prices will be volatile.
Outlook Summary
The medium-term trend is neutral for Treasury bond prices at the moment.

Comments
Log in or sign up to join the conversation.