
Ever since the 2008 debt crisis, economists have debated the impact of rising household debt on economic growth, especially in North America. The ratio of household debt-to-GDP is often cited as the best measure to argue that debt levels are “too high”, and are hindering consumer expenditures, business investment and overall growth. While there is no established theory to guide the discussion, there is a widespread view that debt levels are “too high” and that growth suffers accordingly. The issue appears to be more acute in Canada where the debt ratio has surpassed that of the U.S. and continues to climb (Chart 1).
Chart 1 Household Debt as a Per Cent of Disposable Income
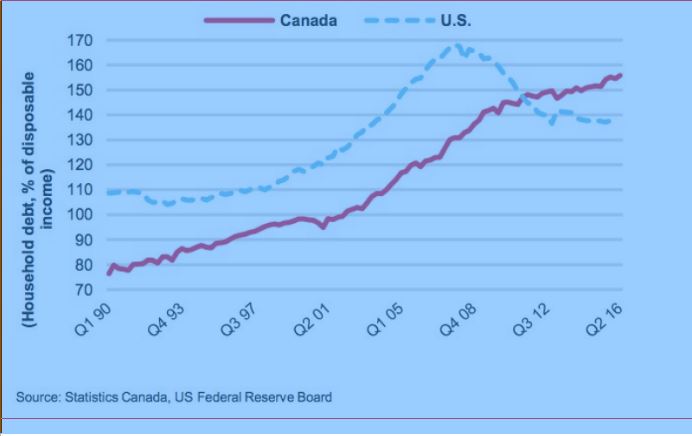
The debt ratio peaked in the U.S. just prior to 2008 and has steadily fallen as consumers de-levered. Canadians, on the other hand continued to push the ratio upwards such that household debt-to- disposal income reached an all time high last quarter .Housing accounts for approximately 40 per cent of total household assets, indicating that Canadians have used leverage to purchase long term assets.
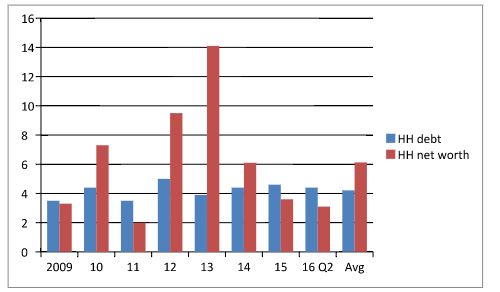
Measuring debt levels against income streams (e.g. disposal income) does not tell the whole story. It is preferable to examine debt against consumer wealth. After all, most of the debt has been assumed in acquiring long term assets rather than for current consumption. Chart 2 records the changes in household debt and household net worth in the U.S. On average, household net worth grew at annual rate of 6 per cent, while household debt grew at a lower rate of just over 4 per cent. Viewed in this context, the U.S. households are justified in taking on more debt as their net worth appreciates. Moreover, the servicing of that debt is a smaller burden today than in the past . In 2009 debt service payments as a per cent of personal disposable income was running at 13 per cent; today that figure has dropped down to just under 10 per cent.
Chart 2 Growth in US Household Net Worth and Debt, 2009-15
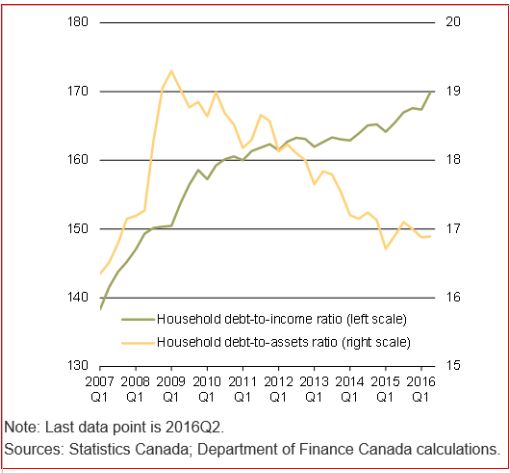
A similar condition exists in Canada where the household debt-to-assets ratio is currently running at 17 per cent , a sizable decline from the level experienced at the height of the 2008 crisis. And, the ratio has stabilized around that level since 2014 when oil prices declined sharply.
Chart 3 Canadian Household Debt-to-Income and Debt-to-Asset Ratios
.
So, where lies the concern that debt levels are “ too high”? The principal threat facing householders with debt is that interest rates rise significantly in a relatively short time. Without sufficient time to adjust one’s debt levels and assets, the result would be both a sharp increase in service costs and a commensurate decrease in net worth.
Notwithstanding, all indications are that the Fed intends to raise the Fed fund rate very slowly and over several years before reaching some normalized level. (That rate decision may be in abeyance given the expected market volatility following yesterday’s election of Trump ). The situation is quite different in Canada, as the Bank of Canada is unlikely to raise its bank rate in light of the underperformance of the economy since the oil price collapse. As long as the household-to-asset ratios remain around these current levels, household debt does not pose any serious risk to either the U.S. or Canadian economies.
.


Comments
Log in or sign up to join the conversation.