
“My interpretation of financial markets differs from the prevailing paradigm in many ways. I emphasize the role of misunderstandings and misconceptions in shaping the course of history. And I treat bubbles as largely unpredictable. The direction and its eventual reversal are predictable; the magnitude and direction of the various phases is not. ” ~ George Soros
Good morning!
In this week’s Dirty Dozen [CHART PACK] we go through all the danger signals suggesting its odds on we soon see a 1-2 month pullback/consolidation range. We follow that up with the reasons why this isn’t the market top but rather a normal pullback in a broader uptrend. After that, we dive into the reasons why the reflation trade is about to take a bit of a breather and end with biotech long breaking out of long-term consolidation.
Let’s dive in.
***click charts to enlarge***
- Sentiment & positioning is one of those things that doesn’t matter until it really does. Here’s the breakdown of the current “euphoric” environment via BofA:
- A record net 19% FMS investors assuming higher than normal risk
- FMS cash level of 3.9% have triggered a ‘sell signal’
- Global Risk-Love indicator is in the 97th percentile of history going back to 1987
- EU Risk Appetite indicator is in overbought territory
- Asia ex-Japan and Emerging Market Risk-Love Indicators are signaling euphoria for the first time since 2015
- The Sell-Side Indicator is at its closest level to a ‘sell signal’ since the GFC

- BofA points out that vaccine optimism and the US elections have “led to a surge in equity flows, with two-month flows into DM and EM equity funds the highest since [Oct 2000]. November alone saw the highest monthly inflow into global equity funds on record. Also over a three-month horizon, we’ve now seen the highest inflows into equity funds on record.”

- Asia ex-Japan Risk-Love indicator’s Euphoria / Bearish Signal suggests weak 6-month forward returns in Asia/EM.

- The Dow Jones Transportation Average triggered a sell signal in January. Here’s how to read this chart.
December’s Doji (highlighted in yellow) gave us a sell setup. January’s Outside Bear Bar closed on its lows and gave us a sell signal. But, the incredibly strong bullish thrust of the preceding 8 bars means this pullback will likely be bought after a 1-2 month pullback/consolidation.
![]()
- Investors who continue to try and call a top will once again be disappointed… The economic backdrop is not one you want to fade. 92% BofA’s proprietary suite of growth indicators “are flagging a Bullish/Neutral signal, the highest level on record.”

- This growth is being driven by a tsunami of liquidity. BofA writes “…the last three decades have not witnessed this combination of animal spirits and a system flush with liquidity. All regions across the world are, at present, privy to surplus free liquidity — currently growing at 55% YoY in the US (highest on record since 1980; substantially higher than 32% in the aftermath of the Global Financial Crisis.”

- While the long-term economic backdrop looks increasingly bullish, the shorter-term one has been widely discounted and is at increased risk of a washout.
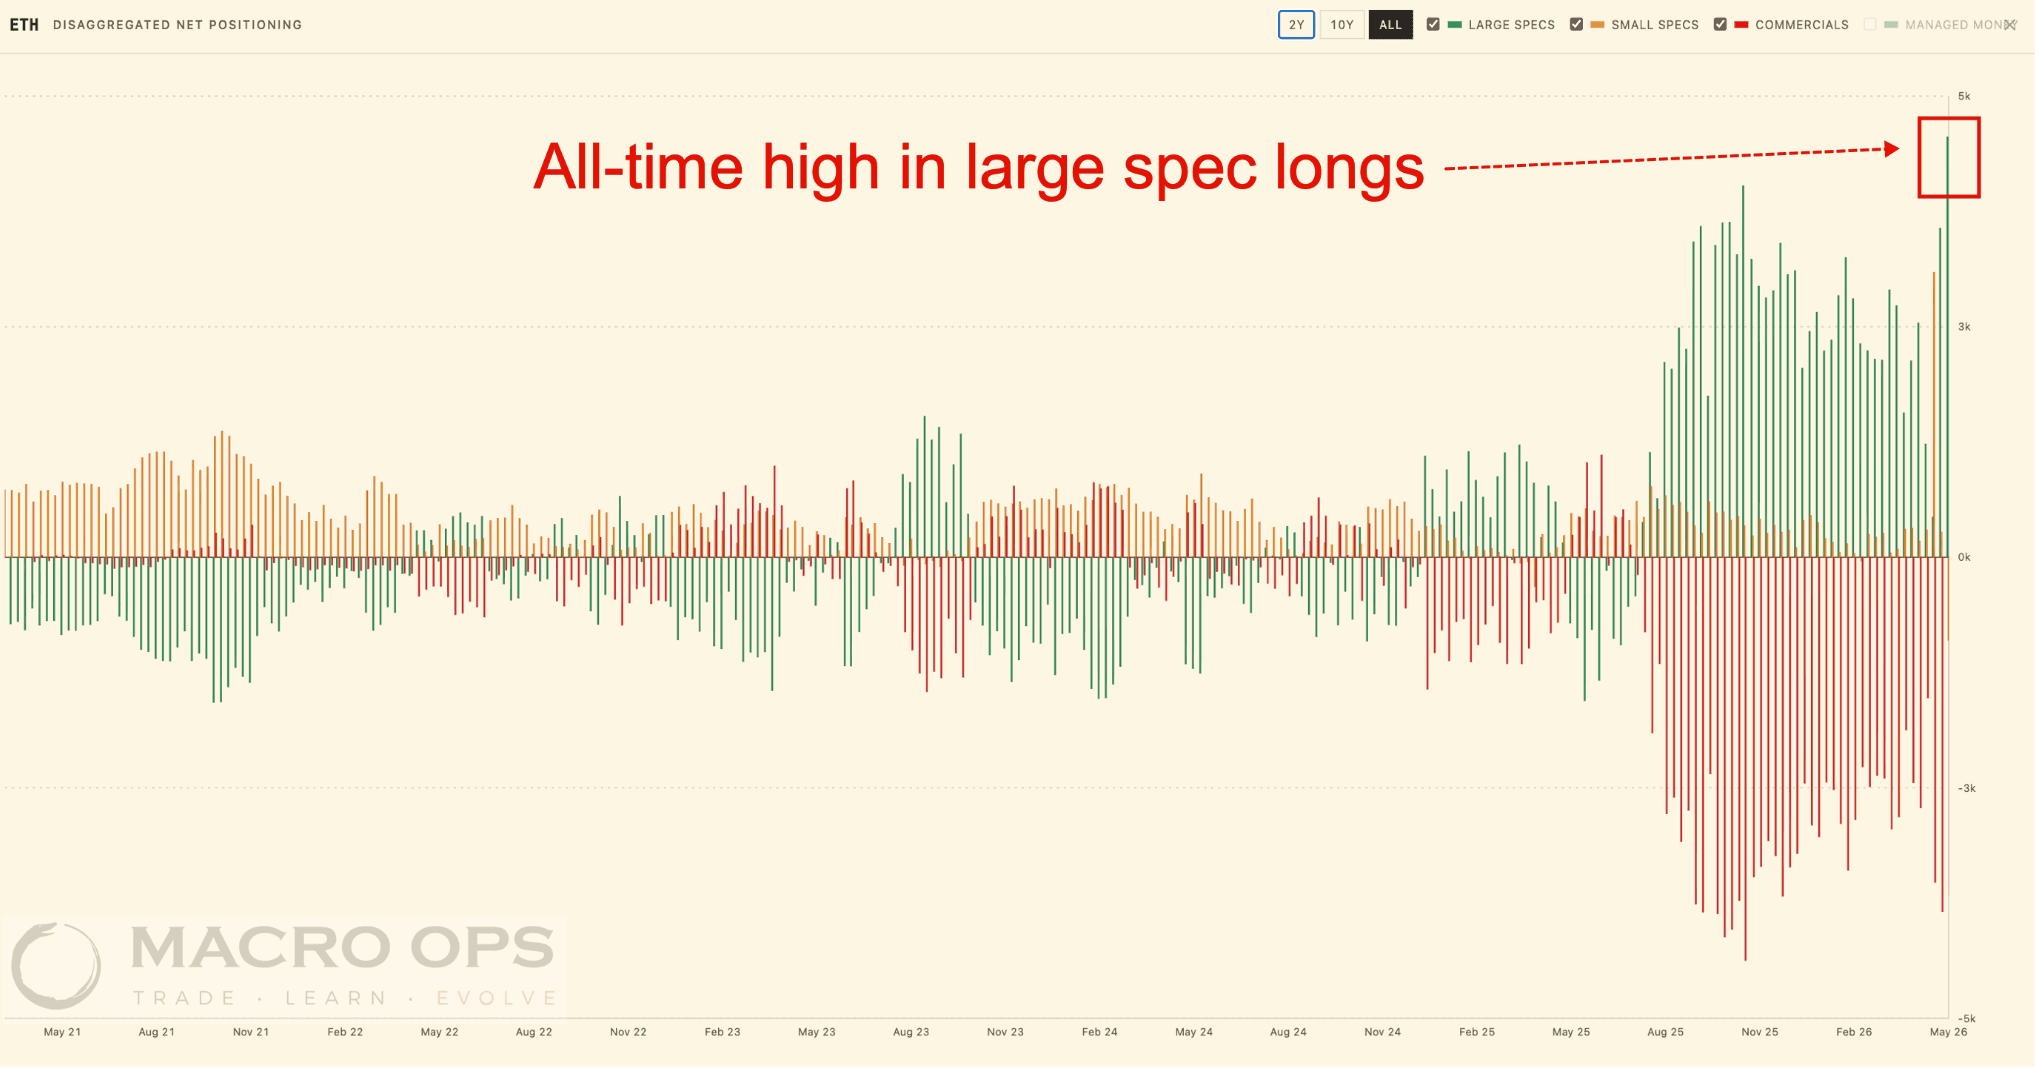
Bloomberg points out that money managers are more long commodities now than they have ever been in at least a decade.

- The rebounding economy and wall of liquidity plus declining COVID hospitalizations (largely driven by increasing vaccination numbers) here in the US definitely support the reflation narrative.

- However, the same cannot be said for the rest of the world. The WSJ quotes a recent UBS report, saying “At the current rates of vaccination, only about 10% of the world would be inoculated by the end of the year and 21% by the close of 2022.”

- The US’s greater capacity for fiscal policy combined with its inordinate access to vaccines means it’s likely to outperform the rest-of-the-world on the economic growth front. That superior relative growth performance could upset the extremely crowded short USD positioning and potentially kick-start a risk-off feedback loop.

- While I remain a cyclical USD bear, I do believe there’s a decent probability we’re about to see a multi-month counter-trend move. USDSEK’s monthly chart looks ripe for a reversal.

- SPDR’s S&P Biotech ETF (XBI) looks to have ended its multi-year bout of relative underperformance versus the Nasdaq. Bios have some of the strongest long-term charts at the moment. Illumina (ILMN) is one of these names with a great tape. Last month, the stock broke out of a 2 ½ year consolidation range.


Comments
Log in or sign up to join the conversation.