

We miss the old days when the amplification factor for the S&P 500 (SPY) was virtually a constant.
Because if it was still a constant, the 5.9% plunge in the S&P 500 would be easy to understand as a Lévy Flight, a sudden large change in value following a series of much smaller changes.
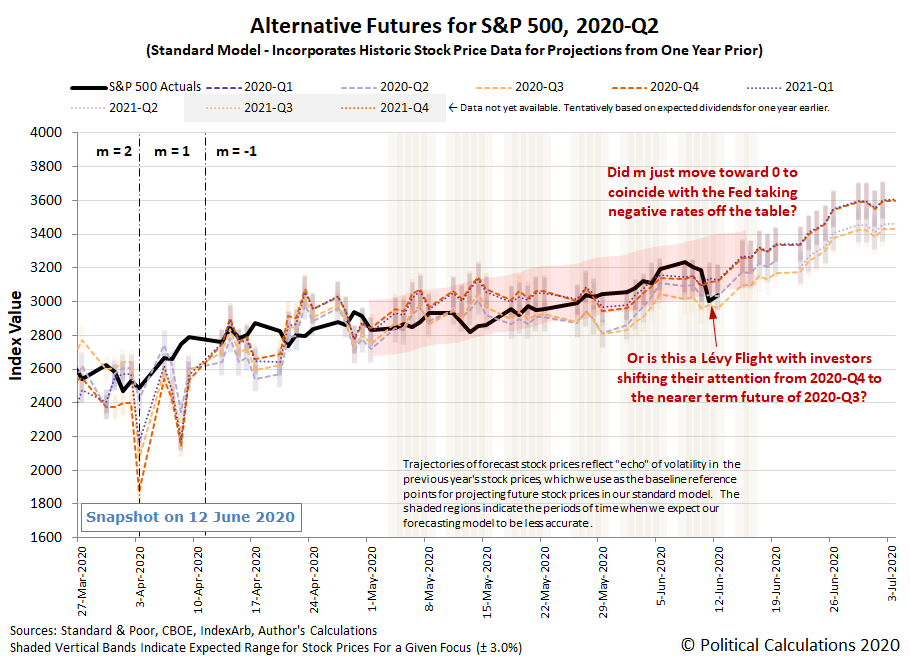
That large plunge came on Thursday, 11 June 2020, following the Federal Reserve's latest two-day meeting the day before, in which the U.S. central bank committed to hold the Federal Funds Rate in the zero bound range, between 0% and 0.25%, for at least two years - which would take a significant portion of the potential for negative rates off the table.
The following snapshot from the CME Group's FedWatch tool shows the expectations that came with the Fed's announcement, which is quite different from what we observed last week.
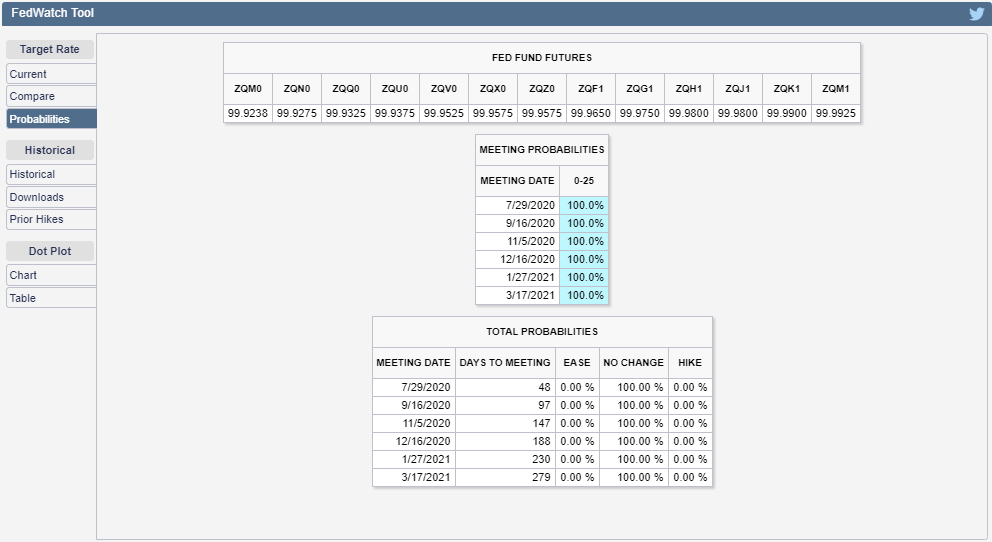
That change in expectations could have prompted the large drop in stock prices on Thursday, 11 June 2020 because it would lead investors to conclude the Fed's monetary policy will be less expansionary than what they had been expecting, with the result being that stock prices fell, just as we described might happen in the "what if" scenario we presented back on 26 May 2020.
That outcome would be the result of changing the value of the amplification factor in a more positive direction in our dividend futures-based model, which would coincide with a similar shift in the future expectations for the Federal Funds Rate away from the potential of becoming negative.
Or, it could be that investors suddenly shifted their forward looking focus from 2020-Q4 toward the nearer term future of 2020-Q3 in a new Lévy Flight event, which is also suggested in the alternative futures chart based on the dividend futures-based model above.
We'll need several more days of data to sort out which of these two potential explanations for the sudden large drop in stock prices makes for a better description of how stock prices have behaved. Right now, our sample size consists of just two days worth of data, which isn't enough in the current environment to get a solid read on the situation.
What we're looking for is whether the trajectory of the S&P 500 follows the trajectory associated with 2020-Q3 in the alternate futures chart above, which assumes that the amplification factor m = -1. If it down, that outcome would be a confirmation that the market experienced a Lévy Flight event as investors acted to change their forward time horizon.
Alternatively, if the trajectory of the S&P 500 persistently falls below the projection for investors focusing on 2020-Q3, that would be an indication the amplification factor has itself shifted.
Welcome to our world. Which is also informed by the market-moving headlines we make a point of presenting each week in case somebody someday needs to reconstruct the informational context in which a stock market event occurred!
Monday, 8 June 2020
- U.S. officially in recession after peaking in February 2020, plus other signs and portents for the U.S. economy:
- U.S. economy entered recession in February, business cycle arbiter says
- Trump open to another coronavirus relief package: White House
- U.S. consumers grew slightly more optimistic about jobs and earnings in May
- Oil falls 3% despite OPEC+ cuts as Gulf ends voluntary curbs
- U.S. Fed's Main Street lending facility likely to start with a whimper
- Bigger trouble developing in Eurozone:
- German industrial output posts record plunge, no quick recovery in sight
- Italy's debt unsustainable, will face eventual restructuring: Schroders
- Spain's economy could shrink by up to 21.8% in second quarter, Bank of Spain says
- Dutch economy set to shrink at record pace in 2020: central bank
- Belgium to lose three years of growth due to pandemic
- Bigger trouble developing in Japan, fewer options:
- Stocks rally on quick economic revival hopes, oil slides
Tuesday, 9 June 2020
- Daily signs and portents for the U.S. economy:
- Bigger trouble developing in the Eurozone:
- ECB minions setting limits on Eurozone governments and banks:
- Chinese government cracks down on street vendors after praising them as job creators:
- S&P 500, Dow ease as focus shifts to Fed; tech pushes Nasdaq to closing record
Wednesday, 10 June 2020
- Daily signs and portents for the U.S. economy:
- Bigger stimulus developing in Eurozone:
- ECB minions resisting bigger stimulus in Eurozone:
- Fed minions see slow growth, set policy to control Treasury yield curve:
- S&P 500, Dow finish lower in volatile trade on dour Fed forecasts
Thursday, 11 June 2020
- Daily signs and portents for the U.S. economy:
- Fed minion shares dismal outlook, promises zero bound rates for two years, defends slow response:
- Wall Street plunges to close with biggest one-day loss since March 16
Friday, 12 June 2020
- Daily signs and portents for the U.S. economy:
- Bigger trouble developing in the Eurozone, United Kingdom:
- Bigger stimulus coming in the Eurozone, with a cost:
- Fed minions send mixed messages:
- Wall Street ends higher but indexes mark worst week since March selloff
Did we miss anything worthy of note? If it helps, that's why we both read and link to Barry Ritholtz' succinct summary of the positives and negatives he finds in each week's markets and economy news, because getting a range of viewpoints about what matters to the market makes for healthy investing decisions!


Comments
Log in or sign up to join the conversation.