

The Bureau of Economic Analysis announced today that U.S. real GDP grew at a 2.3% annual rate in the first quarter. That’s a modest slowdown from the 3.1% average we saw over the previous 3 quarters. 3.1% is also the average growth rate for the U.S. economy over the last 70 years. But the Q1 reading is pretty much on par with the 2.2% average growth since the Great Recession ended in 2009.
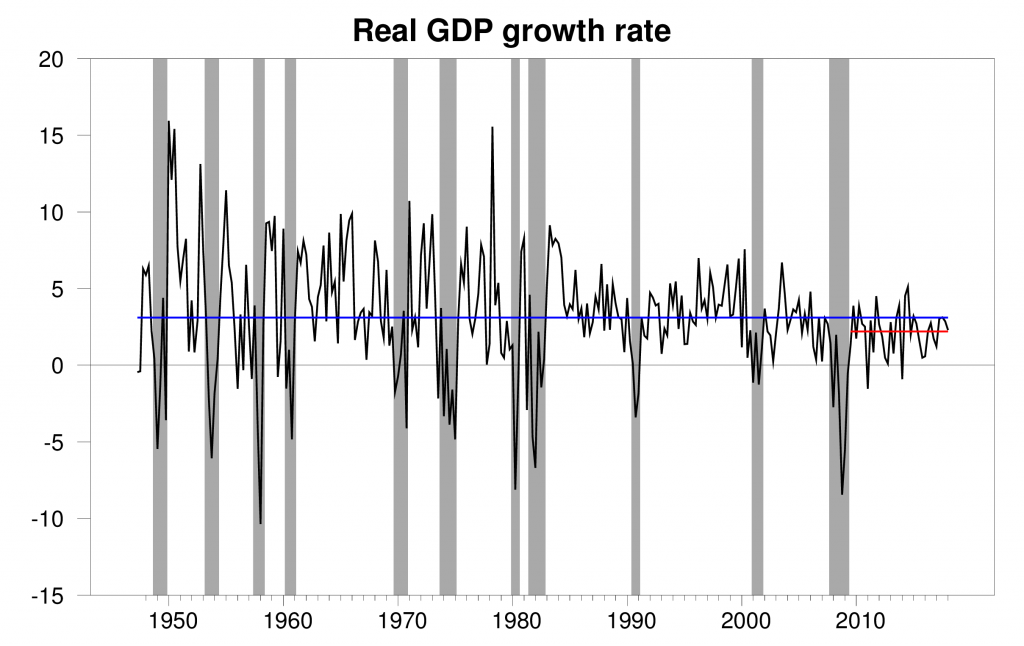
Real GDP growth at an annual rate, 1947:Q2-2018:Q1, with the 1947-2018 historical average (3.1%) in blue and post-Great-Recession average (2.2%) in red.
Slightly softer first-quarter growth is something that’s become pretty typical in the recent data. Since 2010, first-quarter real GDP growth averaged 1.3% at an annual rate, compared with 2.5% for the other three quarters. We get a smoother impression looking at year-over-year growth, which for 2018:Q1 came to 2.8%.
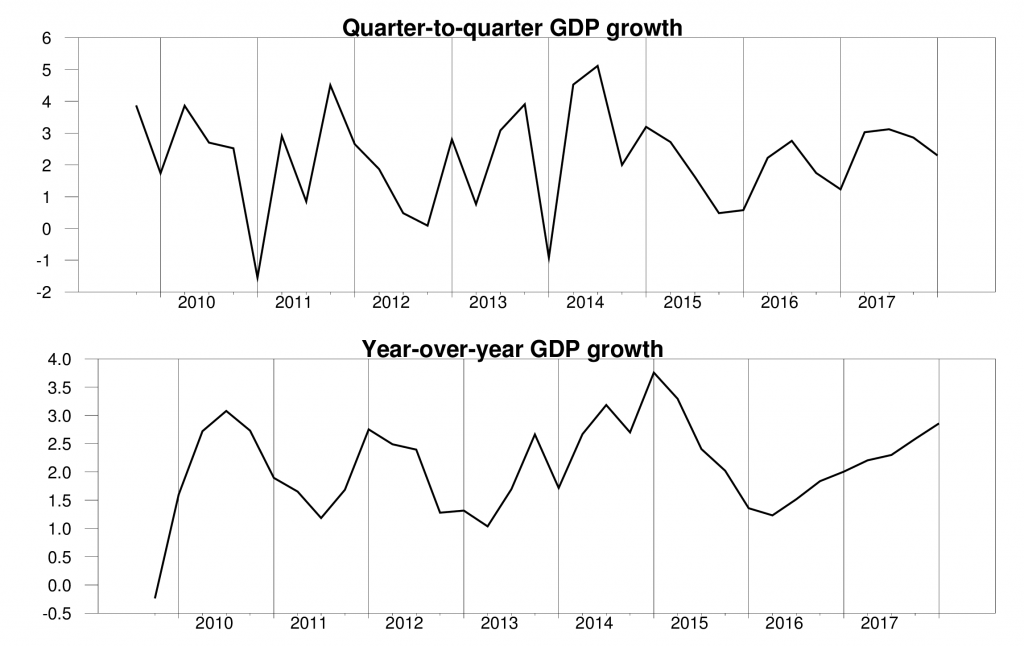
Top panel: quarter-to-quarter real GDP growth, quoted at an annual rate, 2009:Q4 to 2018:Q1. Bottom panel: year-over-year real GDP growth.
With the new data, our Econbrowser Recession Indicator Index held at 2.4%, exactly the same as the previous reading. The U.S. remains clearly in the expansion phase of the business cycle.
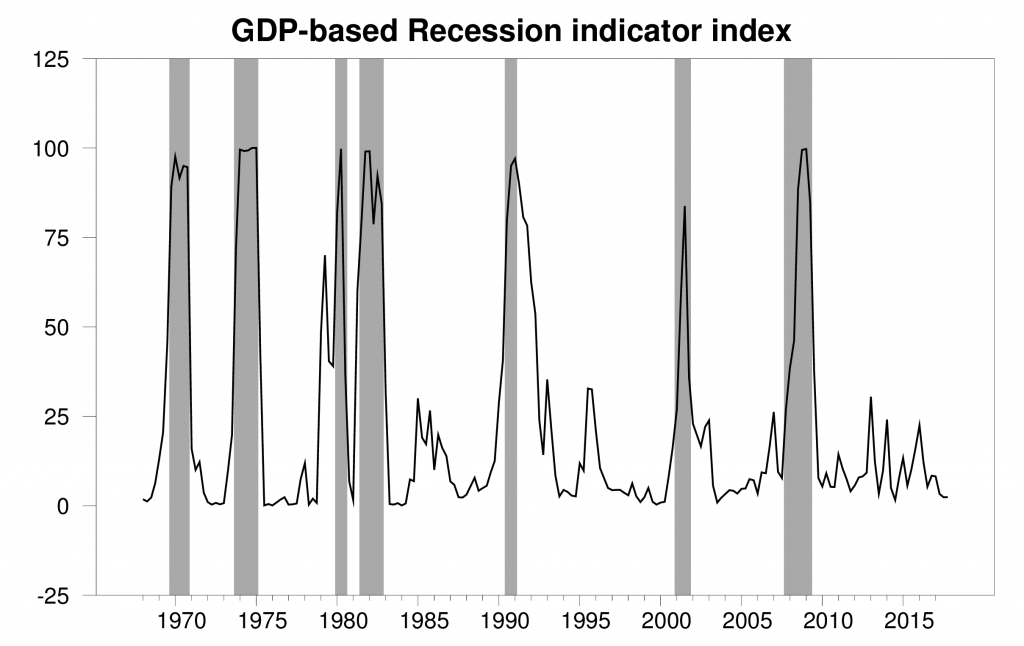
GDP-based recession indicator index. The plotted value for each date is based solely on information as it would have been publicly available and reported as of one quarter after the indicated date, with 2017:Q4 the last date shown on the graph. Shaded regions represent the NBER’s dates for recessions, which dates were not used in any way in constructing the index, and which were sometimes not reported until two years after the date.
Higher exports and nonresidential fixed investment made solid contributions to the first-quarter growth. The main slowdown came from much slower growth in consumption spending than we’d seen in 2007:Q4.
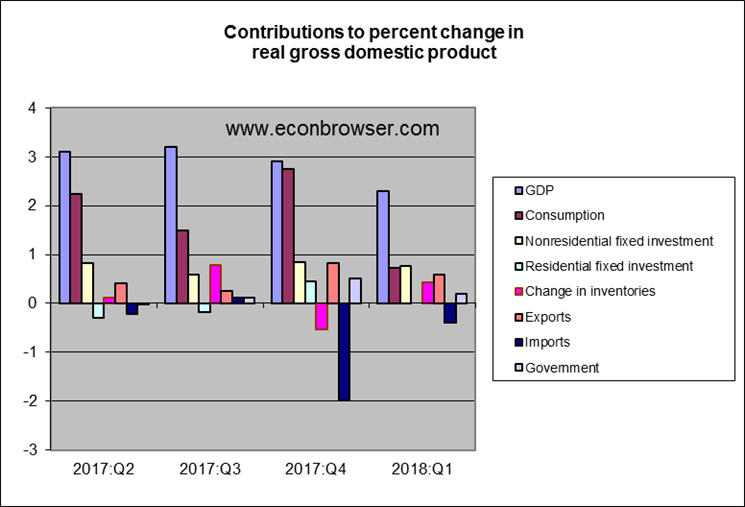
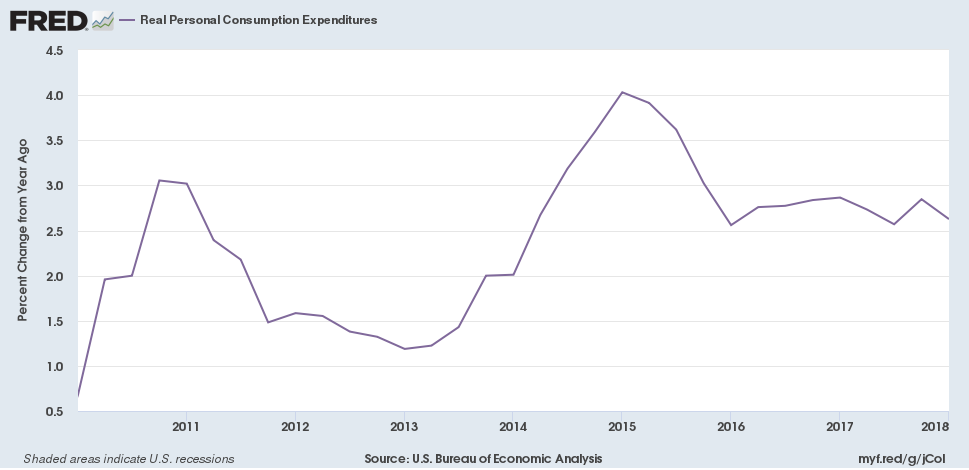
The growth in consumption between 2017:Q4 and 2018:Q1 was unimpressive in part because the Q4 level was so strong. Again, when you look at year-over-year changes, the latest data don’t look particularly alarming.
The always perspicacious Bill McBride notes that nominal nonresidential fixed investment actually grew pretty sharply in Q1 (up 8.2% at a logarithmic annual rate). But this added spending contributed nothing to real GDP growth because all of the surge was attributed to higher cost of housing.
And the implicit price deflator on personal consumption spending was up at a 2.7% annual rate in Q1 for the second quarter in a row.
Bottom line: the report shows the U.S. economy is still growing solidly with some signs that inflation is starting to pick up.
Comments
Log in or sign up to join the conversation.