


After trailing the cap-weighted S&P 500 by 4.61 percentage points in September, the equal-weight index beat the cap-weighted index by 5.85 percentage points in October. That's its biggest monthly outperformance since April 2009 and the second-largest since 1990.
The reversal between the two months is even more extreme. The chart below shows monthly performance spreads between the cap-weighted and equal-weight S&P 500 since 1990. Positive readings indicate cap-weighted outperformed, and negative readings indicate equal-weight outperformed.
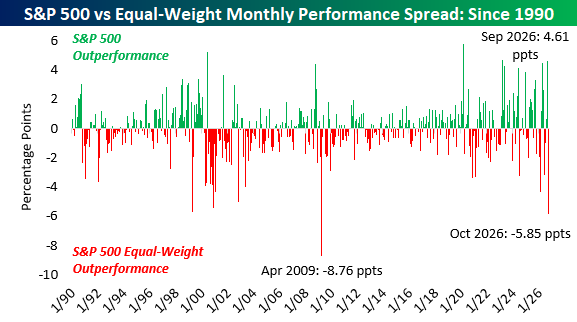
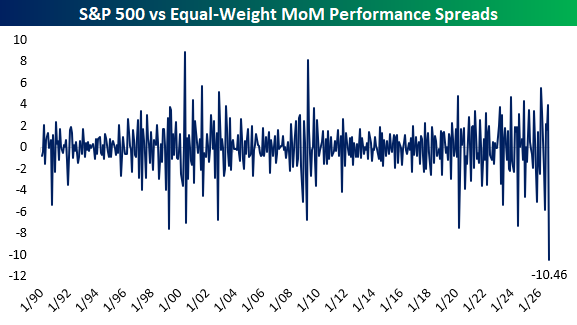
September’s sizable advantage for the cap-weighted index makes October’s reversal particularly noteworthy. The spread has swung 10.46 percentage points toward equal-weight, the largest monthly move in either direction since at least 1990. For all the attention paid to the dominance of the market’s largest stocks, leadership can change considerably in a hurry!
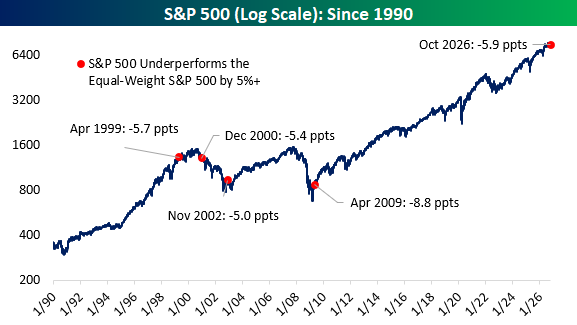
Does this kind of outperformance from the average stock tell us anything about where the broader market goes next? The chart below plots the S&P 500 with red dots marking months when equal-weight outperformed by at least five percentage points. Before this month, there were just four occurrences: April 1999, December 2000, November 2002, and April 2009.
Those dates cover very different points in the market cycle. April 1999 came as the late-1990s bull market still had room to run. December 2000 fell during the subsequent bear market, and November 2002 and April 2009 came shortly after major market lows.
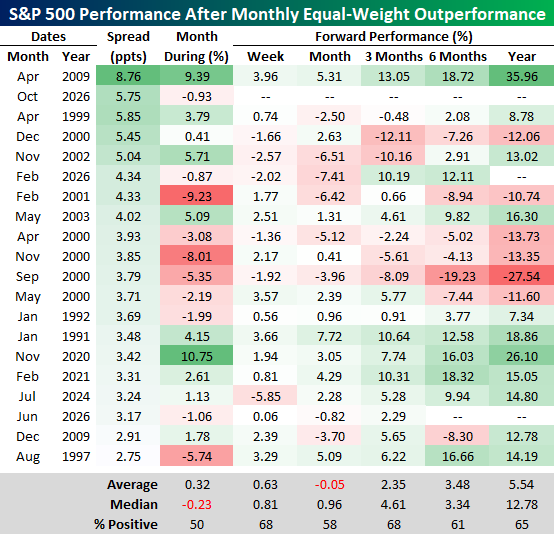
Below is a look at the 20 best months for equal-weight versus cap-weighted in history along with how the S&P 500 performed in the months and year ahead.



Comments
Log in or sign up to join the conversation.