
Total seasonally adjusted trade deficit averaged $75.1 mn, vs. 2024 $75.3 mn. The real goods trade deficit averaged $99.8 mn Ch.2017$ vs. 94.4 mn Ch.2017$. In other words, the real goods trade deficit increased (the same is true of the real goods ex-petroleum trade deficit).
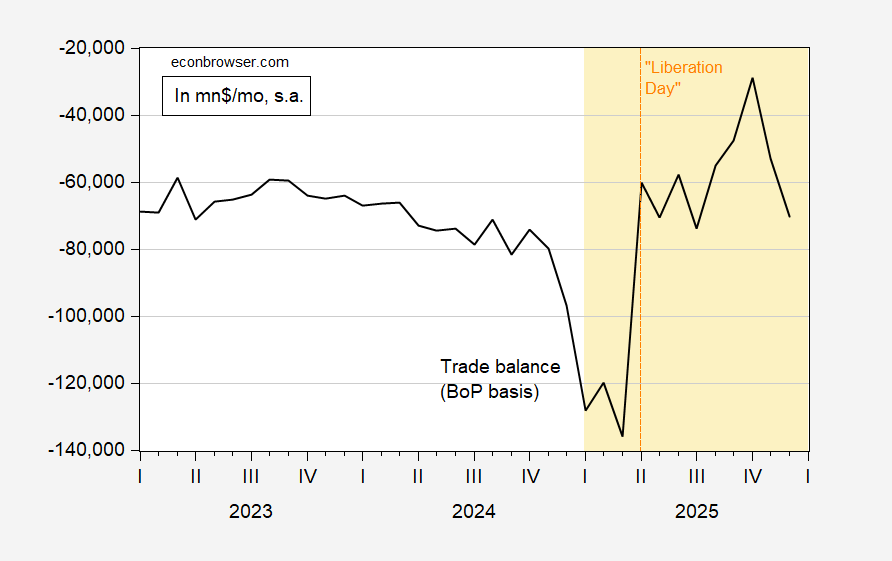
Figure 1: Trade balance, BoP basis, mn$ (black). Source: BEA.
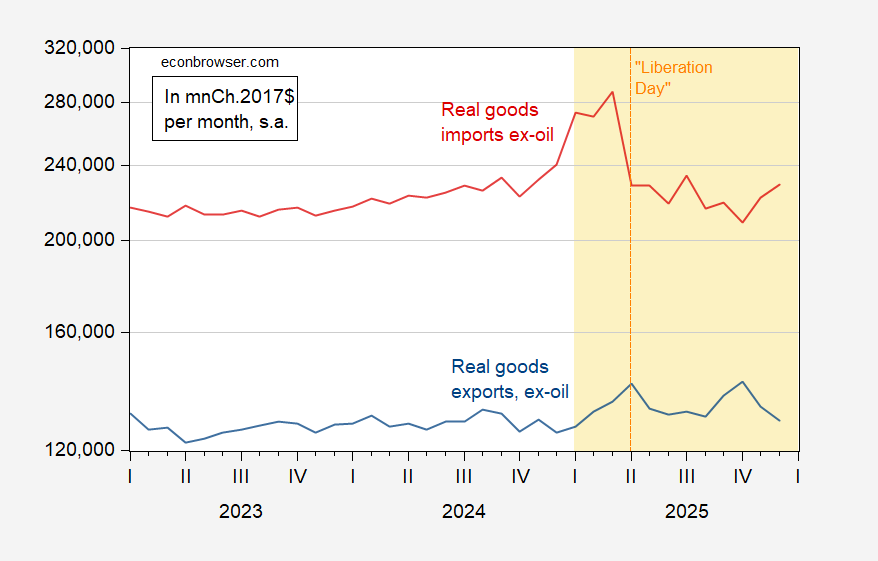
Figure 2: Real goods exports, ex-petroleum per month (blue), real goods imports, ex-petroleum per month (red), both in mnCh.2017$, s.a. Source: BEA.
If you thought macroeconomic aggregates (private saving vs. private investment, government budget balance, net income flows) determined primarily the trade balance, this outcome would not be very surprising.


Comments
Log in or sign up to join the conversation.