


Image Source: Pixabay
Despite the rise to $2,500 an ounce, gold is still below where it was in 1971 in terms of percentage of assets on the Federal Reserve's balance sheet. Back on August 15, 1971 - exactly 53 years ago yesterday - gold made up 12% of Fed assets. Today, even at $2,500, it makes up less than 9%. By those metrics, we are lower now at $2,500 than we were at $35 in 1971. From that point, gold rose by a factor of 24x to the 1980 top. A repeat of that move brings us to a top of about $60,000 per ounce.
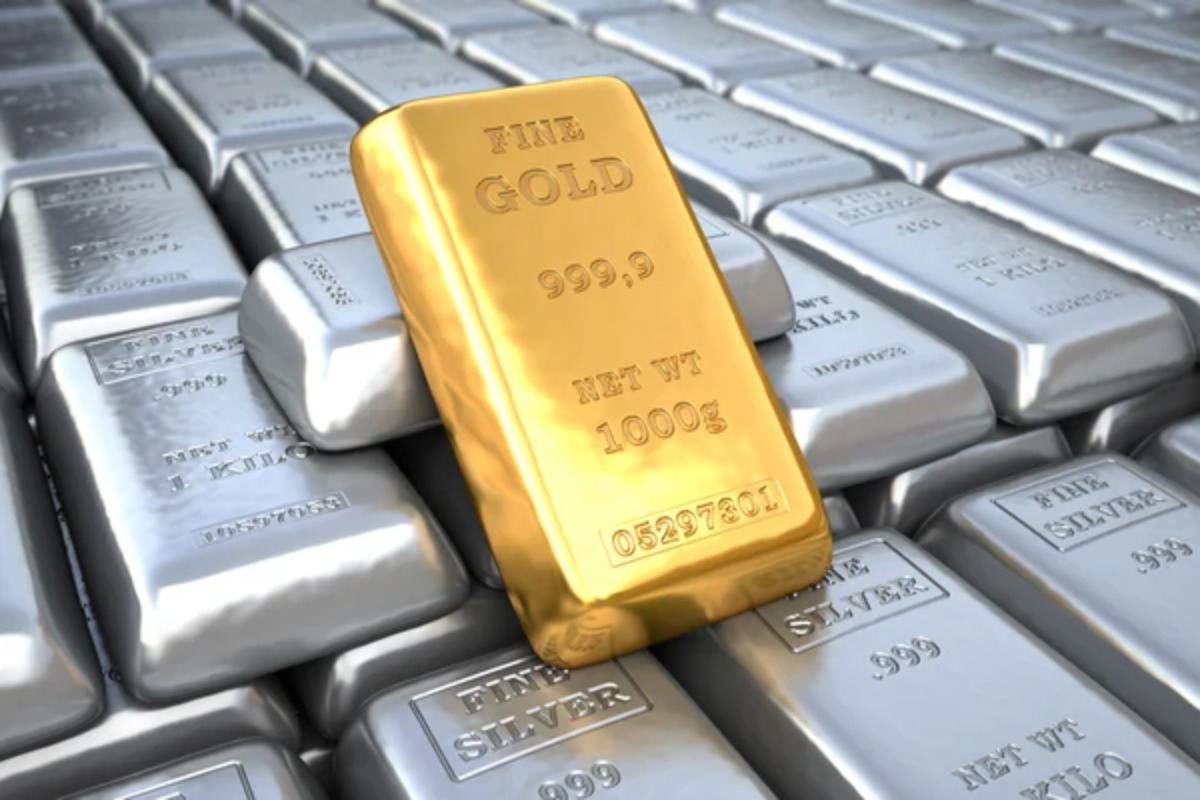
That rally also ended with a 15:1 gold to silver ratio. That brings us to $4,000 per silver ounce in a full blown monetary panic.
This is not a prediction. It's just simple math, and if we do have a repeat of the 1970s, that it where the math leads.
Video Length: 00:16:12
More By This Author:
Is The Sell-Off In The Gold Market Over?
Is The Stock Market Bubble Finally Popping?
Retail Gold, Silver Buying Picks Up After Stock Market Plunge
Comments
Log in or sign up to join the conversation.