
Yellen: “Our Brand Is Crisis”
With the Federal Reserve now indicating they are “really serious” about “normalizing” interest rates, read “tightening” monetary policy, there have come numerous articles, and analysis, discussing the impact on asset prices. The general thesis is based on averages of historical tendencies suggesting equity bull markets never die simply of old age. They do, however, die of excessive Fed monetary restraint. As previously noted by David Rosenberg:
“In the past six decades, the average length of time from the first tightening to the end of the business cycle is 44 months; the median is 35 months; and the lag from the initial rate hike to the end of the bull equity market is 38 months for the average, 40 months for the media.”
So, that analysis would suggest that since the Fed hiked in December of 2015, there is still at least two years left to the current business cycle. Right?
Maybe not.
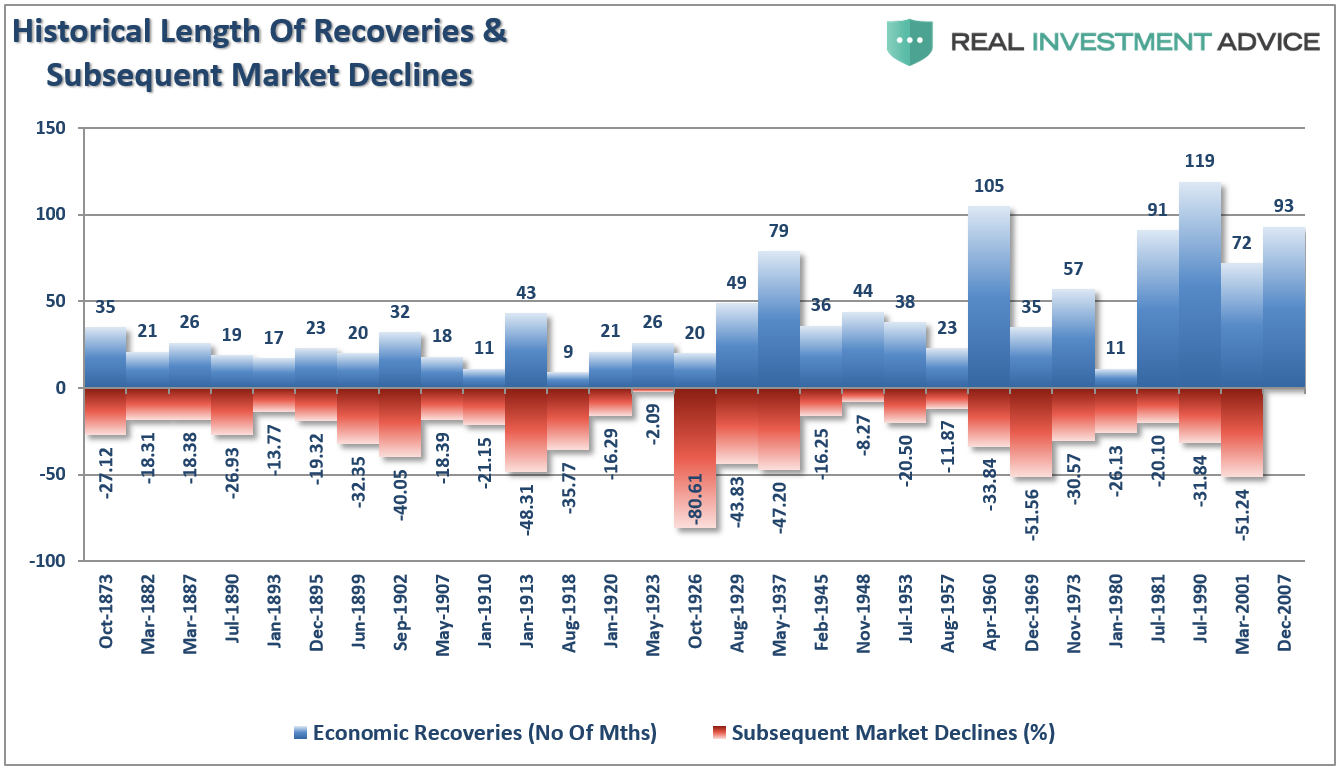
First, averages and medians are great for general analysis but obfuscate the variables of individual cycles. To be sure the last three business cycles (80’s, 90’s and 2000) were extremely long and supported by a massive shift in financial engineering and credit leveraging cycle. The post-Depression recovery and WWII drove the long economic expansion in the 40’s, and the “space race” supported the 60’s. You can see the length of the economic recoveries in the chart below. I have also shown you the subsequent percentage market decline when they ended.
(Click on image to enlarge)
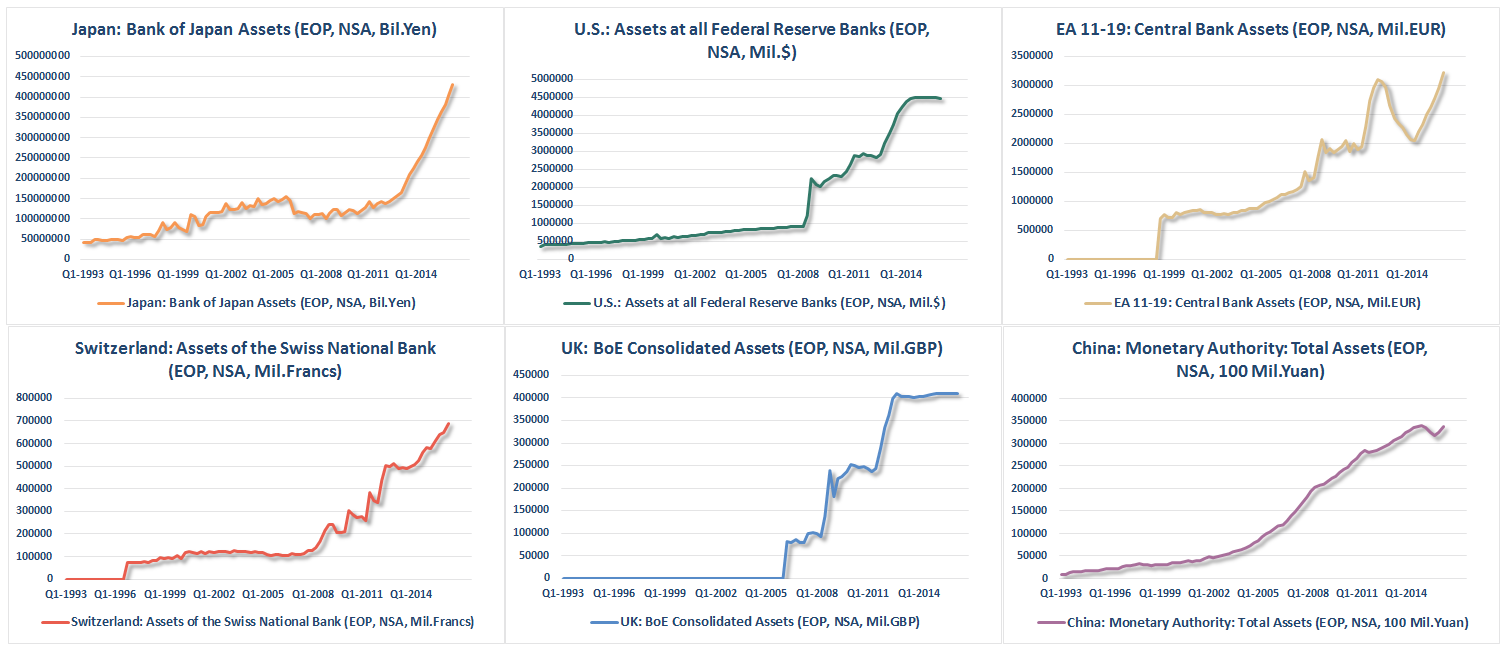
Currently, employment and wage growth is extremely weak, 1-in-4 Americans are on Government subsidies, and the majority of American’s living paycheck-to-paycheck. This is why Central Banks, globally, are aggressively monetizing debt in order to keep growth from stalling out.
(Click on image to enlarge)
If the Fed continues to hike rates, and the next recession doesn’t occur for another two years as David suggests, this would be the single longest economic expansion in history based on the weakest economic fundamentals.
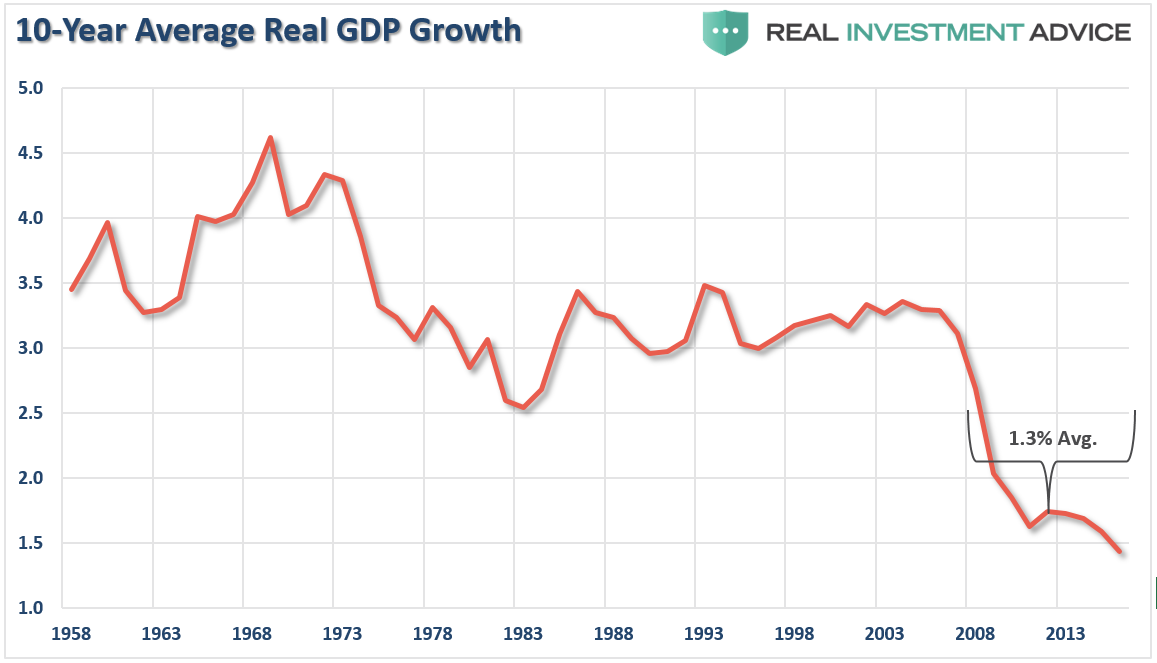
Secondly, the above analysis misses the level of economic growth at the beginning of interest rate hiking campaign. The Federal Reserve uses monetary policy tools to slow economic growth and ease inflationary pressures by tightening monetary supply. For the last six years, the Federal Reserve has flooded the financial system to boost asset prices in hopes of spurring economic growth and inflation. Outside of inflated asset prices, there is little evidence of real economic growth as witnessed by an average annual GDP growth rate of just 1.3% since 2008, which by the way is the lowest in history since…well, ever.
(Click on image to enlarge)
The chart and table below compare real, inflation-adjusted, GDP to Federal Reserve interest rate levels. The vertical red bars denote the quarter of the first rate hike to the beginning of the next rate decrease or onset of a recession.
(Click on image to enlarge)
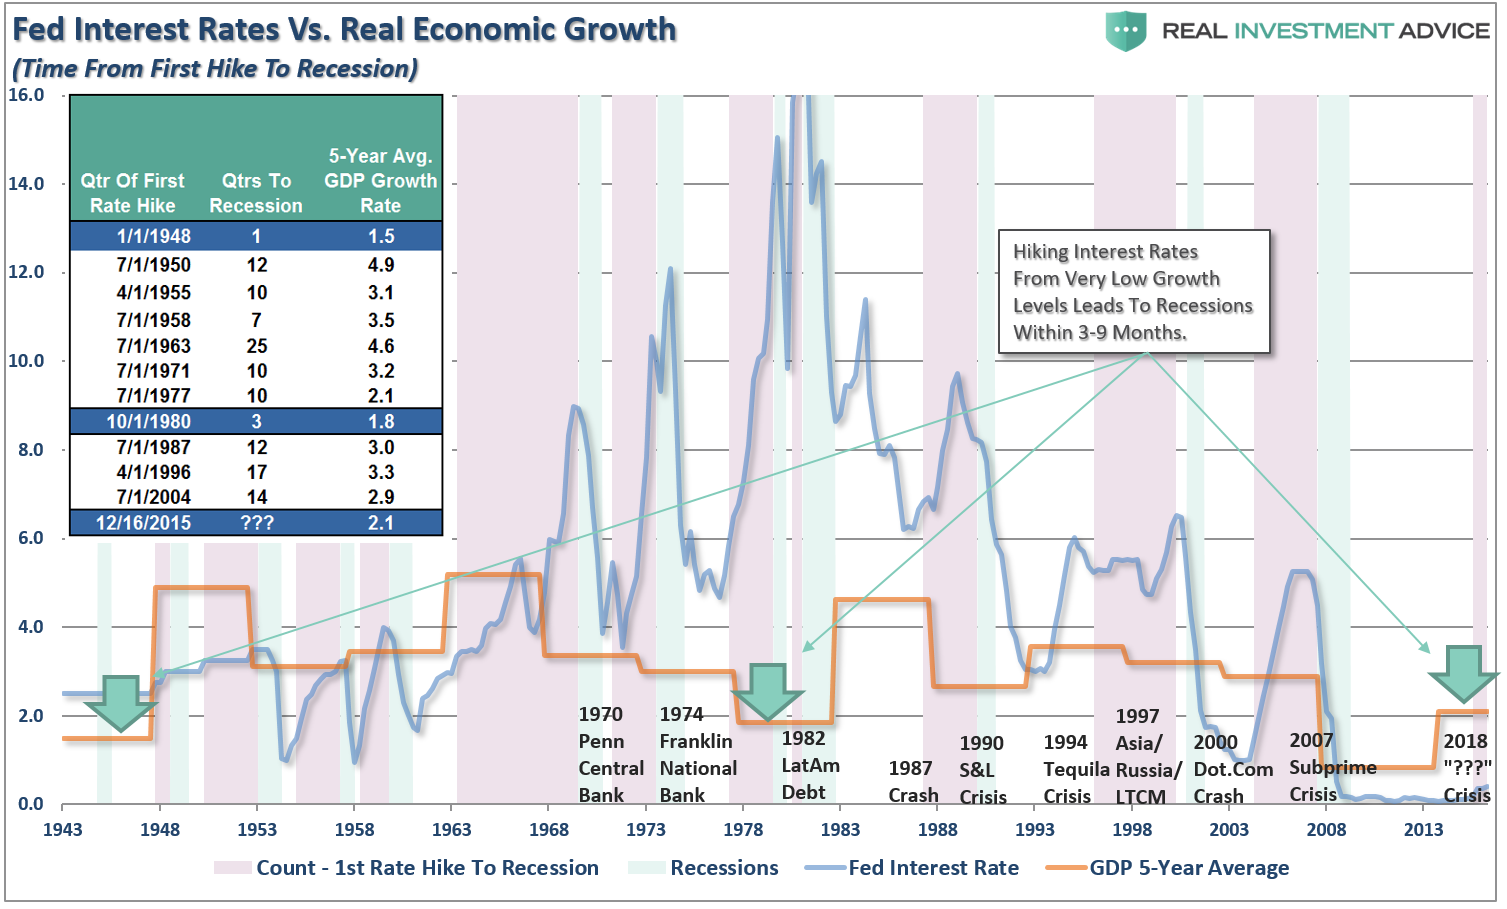
If I look at the underlying data, which dates back to 1943, and calculate both the average and median for the entire span, I find:
- The average number of quarters from the first rate hike to the next recession is 11, or 33 months.
- The average 5-year real economic growth rate was 3.08%
- The median number of quarters from the first rate hike to the next recession is 10, or 30 months.
- The median 5-year real economic growth rate was 3.10%
However, note the GREEN arrows. There have only been TWO previous points in history where real economic growth was near 2% at the time of the first quarterly rate hike – 1948 and 1980. In 1948, the recession occurred ONE-quarter later and THREE-quarters following the first hike in 1980.
The importance of this reflects the point made previously, the Federal Reserve lifts interest rates to slow economic growth and quell inflationary pressures. There is currently little evidence of “good” inflationary pressures outside of financial asset prices, and economic growth is weak, to say the least.
Therefore, rather than lifting rates when average real economic growth was at 3%, the Fed is doing this with rates closer to 2% over the last 5-years.
Think about it this way.
If it has historically taken 11 quarters to go fall from an economic growth rate of 3% into recession, then it will take just 2/3rds of that time at a rate of 2%, or 6 to 8 quarters at best. This is historically consistent with previous economic cycles, as shown in the table to the left, that suggests there is much less wiggle room between the first rate hike and the next recession than currently believed.
Recessions & Bear Markets
If historical averages hold, and since major bear markets in equities coincide with recessions, the current bull market in equities has about 12-18 months left to run. But this also may be a bit overly optimistic.
Given the combination of excessive bullishness, high valuations, weak economic data it is very likely the Fed will trip up the economy, and subsequently the markets, sooner than expected.
While the markets, due to momentum, may ignore the effect of “monetary tightening” in the short-term, the longer-term has been a different story. As shown in the table below, the bulk of losses in markets are tied to economic recessions. However, there are also other events such as the Crash of 1987, the Asian Contagion, Long-Term Capital Management, and others that led to sharp corrections in the market as well.
(Click on image to enlarge)
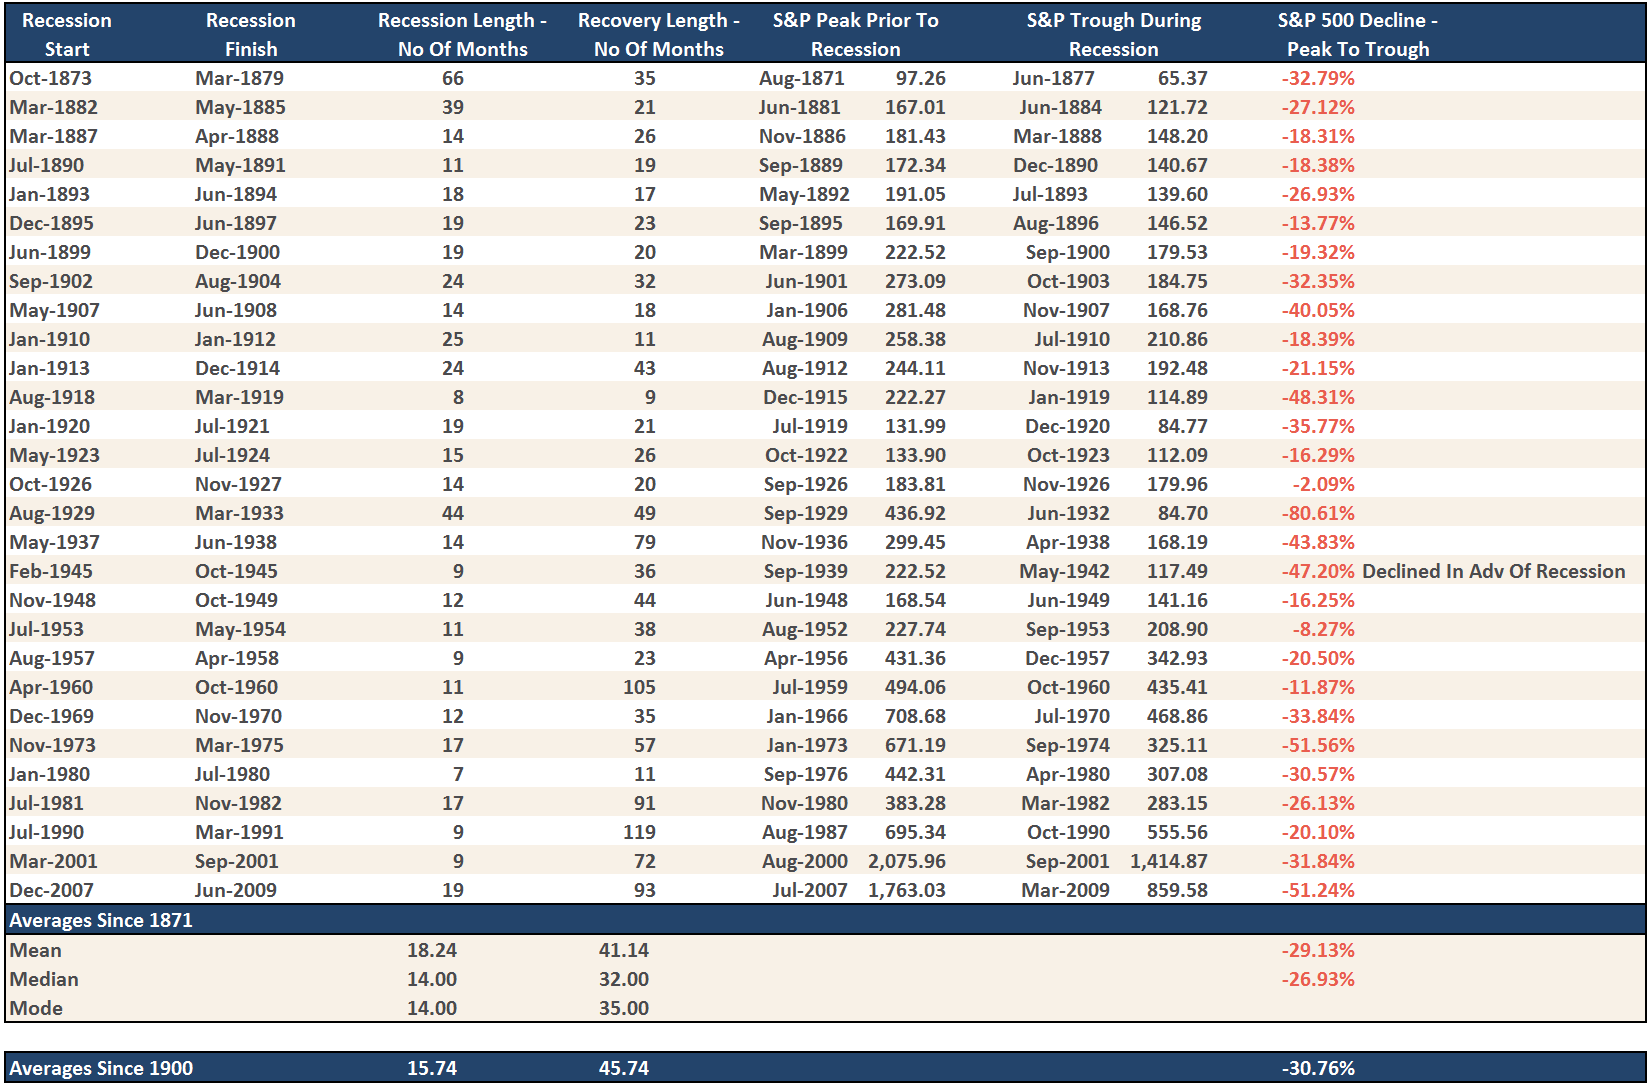
The point is that in the short-term the economy and the markets (due to momentum) can SEEM TO DEFY the laws of gravity as interest rates begin to rise. However, as rates continue to rise they ultimately act as a “brake” on economic activity. Think about the all of the areas that are NEGATIVELY impacted by rising interest rates:
1) Debt servicing requirements increase which reduces future productive investment.
2) The housing market. People buy payments, not houses, and rising rates mean higher payments. (Read “Economists Stunned By Housing Fade” for more discussion)
3) Higher borrowing costs which lead to lower profit margins for corporations.
4) Stocks are cheap based on low-interest rates. When rates rise, markets become overvalued very quickly.
5) The economic recovery to date has been based on suppressing interest rates to spur growth.
6) Variable rate interest payments for consumers
8) Corporate share buyback plans, a major driver of asset prices, and dividend issuances have been done through the use of cheap debt.
9) Corporate capital expenditures are dependent on borrowing costs.
Well, you get the idea. If real economic growth was near historical norms of 3%, this would be a different conversation. However, at current levels, the window between a rate hike and recession has likely closed rather markedly.
Lastly, it isn’t just recessions that have impacted stocks prices in the past. It is often suggested that stocks can withstand rising interest rates.
This claim falls into the category of “timing is everything.”
The chart below has been circulated quite a bit to support the “don’t fear rising interest rates” meme. I have annotated the chart to point out the missing pieces.
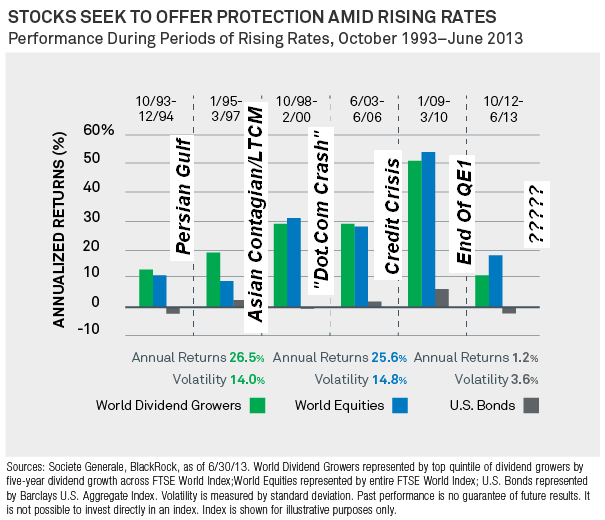
While rising interest rates may not “initially” impact asset prices, it is a far different story to suggest that they won’t.
In fact, there have been absolutely ZERO times in history that the Federal Reserve has begun an interest rate hiking campaign that has not eventually led to a negative outcome.
What the majority of analysts fail to address is the “full-cycle” effect from rate hikes. While equities may initially provide a haven from rising interest rates during the first half of the rate cycle, they have been a destructive place to be during the last half.
It is clear from the analysis is that bad things have tended to follow the Federal Reserve’s first interest rate increase. While the markets, and economy, may seem to perform okay during the initial phase of the rate hiking campaign, the eventual negative impact will push most individuals to “panic sell” near the next lows. Emotional mistakes are 50% of the cause as to why investors consistently underperform the markets over a 20-year cycle.
For now, the bullish trend is still in place and should be “consciously” honored. However, while it may seem that nothing can stop the markets current rise, it is crucial to remember that it is “only like this, until it is like that.” For those “asleep at the wheel,”there will be a heavy price to pay when the taillights turn red.
Just something to think about.
Disclosure: The information contained in this article should not be construed as financial or investment advice on any subject matter. Streettalk Advisors, LLC expressly disclaims all liability in ...
more
Comments
 No Thumbs up yet!

