
USDU Update… An Important Chart
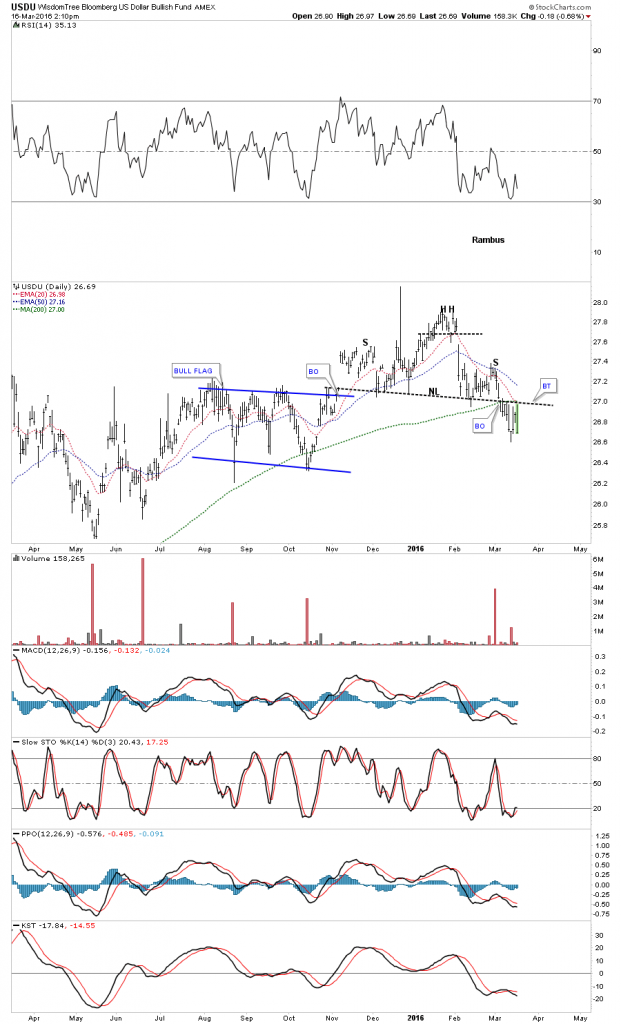
Last week I showed you this potential H&S top forming on the USDU which is a more evenly balanced index for the US dollar which actually trades as an ETF.
I built this chart using a line chart and then leaving the trendlines in place I converted to a bar chart. As you can see it has been backtesting the neckline for the last week or so along with the 200 dma. This chart shows a reversal pattern which sets up a downtrend of some kind. This is an important development.
(Click on image to enlarge)
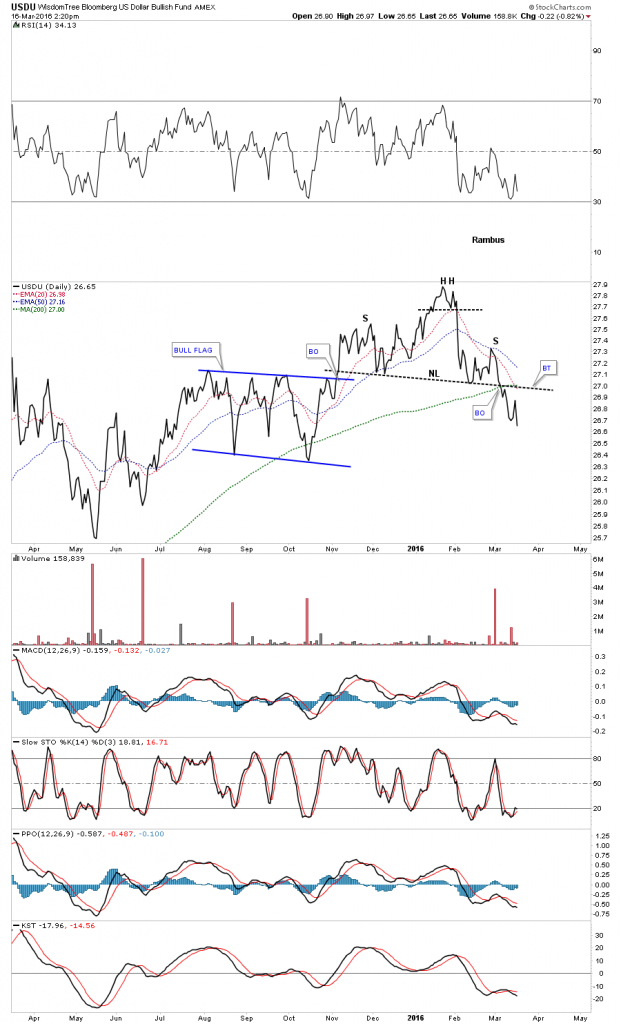
Below is the exact same chart shown as a line chart. Note how much cleaner the trendlines look.
(Click on image to enlarge)
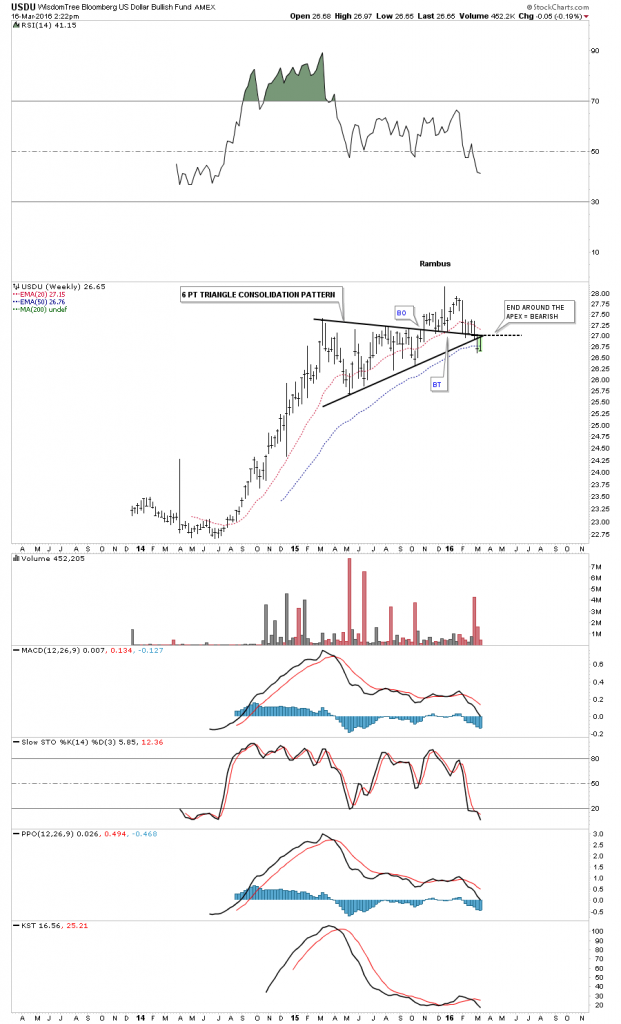
The weekly chart shows an end around the apex move which is also bearish.
(Click on image to enlarge)
Disclosure: None.
How did you like this article? Let us know so we can better customize your reading experience.

Comments
Leave a comment to automatically be entered into
our contest to win a free Echo Show.

