Trade Policy With China
Since President-elect Trump has nominated Peter Navarro* to direct the newly formed Trade Policy Council, now seems a good time to review some trade data.
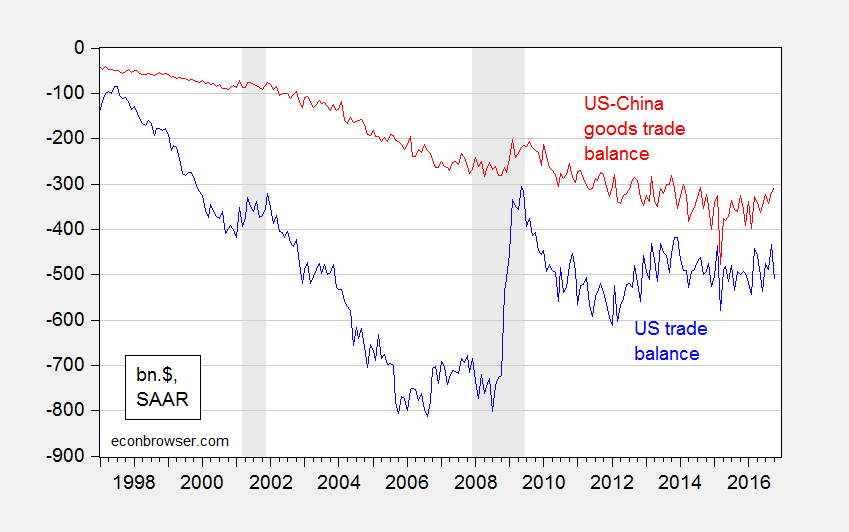
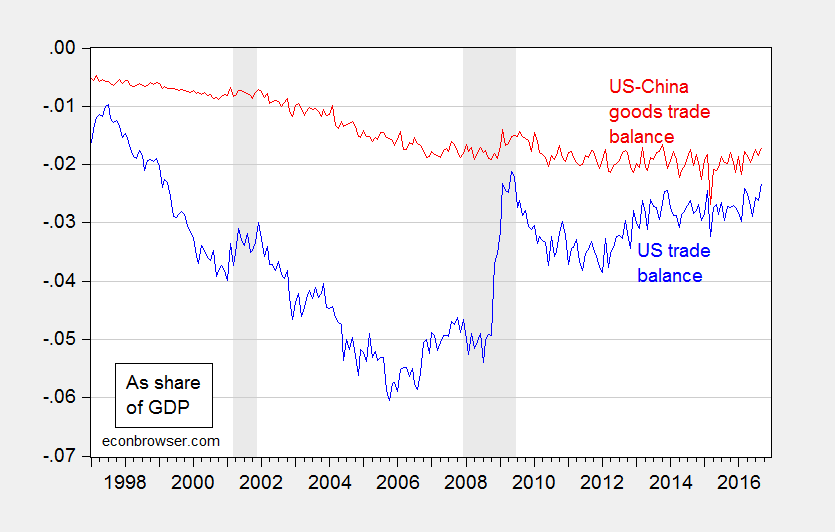
An inspection of the US-China trade balance would seem to highlight the need for some action, especially after comparing the US-China bilateral balance to the aggregate.

Figure 1: US goods and services trade balance, balance of payments basis (blue), and US-China goods trade balance, f.a.s. basis (red), billions of dollars, SAAR. US imports from and to China seasonally adjusted using ARIMA X-12 (multiplicative). NBER defined recession dates shaded gray. Source: BEA, FRED.

Figure 2: US goods and services trade balance, balance of payments basis (blue), and US-China goods trade balance, f.a.s. basis (red), both divided by GDP interpolated using quarterly match. US imports from and to China seasonally adjusted using ARIMA X-12 (multiplicative). NBER defined recession dates shaded gray. Source: BEA, FRED and author’s calculations.
However, it’s of interest to note that up until now, the deficits as shares of GDP have been relatively stable since the end of the Great Recession, with the overall balance shrinking as a share of GDP.
The US-China (goods) deficit is some 60% of the total (goods and services) deficit as of October 2016. However, it’s important to recall that that the bilateral trade balance records the exports and imports from the last source location; hence a $100 widget imported from China, but incorporating $40 components from Malaysia and $50 components from Taiwan, and $10 of Chinese labor, would be counted as $100 worth of imports from China. The value added imported from China (the economically interesting variable) would only be $10 in this example, but $100 of imports is recorded.
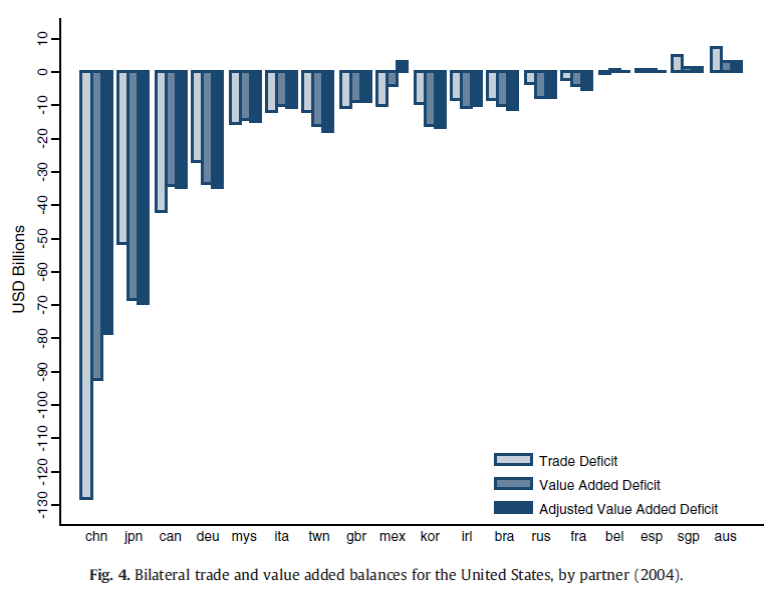
In other words, the calculation does not take into account the development of global supply chains. Johnson and Noguera (2013: 93) show that when accounting for trade in intermediates, the 2004 US-China trade deficit of approximately $125 billion is reduced by $35-$50 billion (30-40% reduction).

Source: Johnson and Noguera (2014).
Now, it’s likely that the domestic component of Chinese exports have risen over time. Nonetheless, it’s still likely true that the bilateral deficit in value added is less than that in gross goods.
It’s also likely that the impact on the trade balance of any restrictive measures on imports will be swamped by the impending dollar appreciation (and associated emerging market downturns).
See earlier discussion of value added and alternative measures of real exchange rates as competitiveness indicators, here. On value chains, see here.
* Full disclosure: I am a former coauthor with Peter Navarro [ more


