Stock Selection Options By Category
In part 1 of this series titled “How Many Stocks Should I Own?” found here, I focused primarily on how many stocks an investor might need to hold in a stock portfolio for adequate diversification. In this part 2, my focus will shift to category selections.
Instead of how many stocks to own, this part 2 relates more to what is the best way to design or construct a common stock portfolio? This is a question I am often asked, and my short answer is always the same – it depends. The truth is, there is no perfect method or strategy for designing a stock portfolio that is right for every individual investor. However, there are principles of sound investing that every investor can follow and apply when designing a common stock portfolio that’s just right for them.
Furthermore, there are general categories that individual investors fall into. Some individuals are young and planning for retirement while other individuals are closer to retirement, and there are some that are already retired. Additionally, each individual investor has different levels of financial resources that specifically apply. To complicate the process, even more, individual investors of all types possess unique goals, needs, objectives and risk tolerances. Therefore, the logical secret to designing a successful common stock portfolio is to design one that’s most appropriate for you.
Therefore, the objective of this series of articles is not to attempt to dictate how individuals should design their own stock portfolios. Instead, the objective of this series is to provide information regarding common stock investing strategies and options that everyone can evaluate and ultimately utilize so they can implement and construct a common stock portfolio that’s just right for them.
At the end of the day, it comes down to making the appropriate choices. The most appropriate choices include, but are not limited to, utilizing the most suitable categories of common stocks available as well as the appropriate mix. In one context, the choices approach the infinite, and this can be confusing or even overwhelming. On the other hand, the options can be generally categorized, thereby simplifying the process to a more manageable level.
Of course, individual investors also have the option of engaging professional help or self-directing their own stock portfolios. This can be done directly by hiring outside professional managers or by investing in packaged products created by professional managers such as mutual funds or ETFs. However, this series of articles is intended for the self-directed individual investor interested in designing and managing their own common stock portfolios. Importantly, this is not about their overall portfolio, just the common stock part.
Stock Selection: What Are the Choices?
On the US stock exchanges alone, individual investors have almost 20,000 individual stocks (companies) to choose from. No matter how diligent you could be, it would be impossible for any individual to conduct a comprehensive analysis of all of them. Therefore, individual investors need a method of separating the wheat from the chaff.
One effective way to accomplish that is to break the larger list down into broader categories based on specific characteristics and attributes. In his best-selling book “One Up On Wall Street,” renowned mutual fund manager Peter Lynch presented what he referred to as “The Six Categories.” Personally, I believe that Peter Lynch provided a succinct summary of the broad categories or types of common stocks available for investment consideration.
However, his six categories are very broad, and therefore, within each category, there are many additional nuances that investors are best served to recognize and understand. Nevertheless, I believe that Peter Lynch provided an excellent foundation with his presentation of the six broad categories available to investors. To clarify this important distinction further, I turn to Peter Lynch and his own words with the following quote:
“There are almost as many ways to classify stocks as there are stockbrokers – but I found that the 6 categories cover all of the useful distinctions that any investor has to make”.
Whether you agree with Peter or not, recognizing some generally broad differences in categories of stocks can certainly help you make better decisions. In part 1 I talked about how many stocks to own, in this part 2B we are focusing on the questions should all categories be included, or should some categories be excluded? I will let the reader make up their own minds after reviewing Peter’s 6 general categories.
Peter Lynch’s Six General Categories
Below I present Peter Lynch’s six general categories with a short description taken directly from his best-selling book “One Up On Wall Street.” Then I present an example or two with a brief commentary of my own with the objective of providing a deeper insight into each category and what each offer from an investment perspective. When appropriate, my examples will come directly from what Peter Lynch said. But most importantly, my examples are not recommendations to buy today; instead, they are just offered as examples of the types of companies Peter Lynch was referencing.
Slow Growers
“Usually these large and aging companies are expected to grow slightly faster than the gross national product. Slow growers didn’t start out that way. They started out as fast growers and eventually pooped out, either because they had gone as far as they could, or else they got too tired to make the most of their chances. When an industry at large slows down (as they always seem to do), most of the companies within the industry lose momentum as well. Electric utilities are today’s most popular slow growers”.
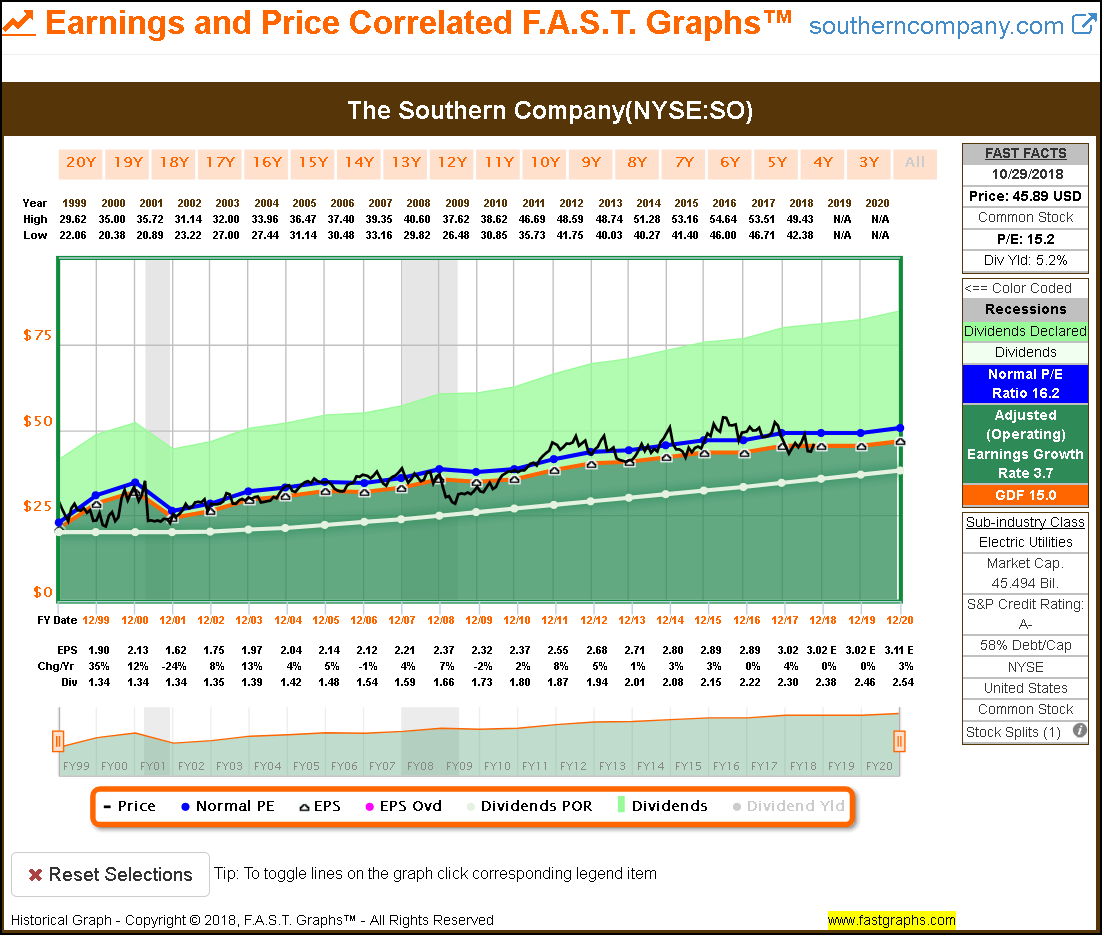
The Southern Company: Classic Example of a “Slow Grower” Utility Stock
As you can see on the following historical earnings and price correlated FAST Graph, the Southern Company (SO) has only averaged earnings growth of 3.5% per annum since 2002. However, note the high yield and the high dividend payout ratio offered to compensate for its slow growth.
(Click on image to enlarge)
The Stalwarts
“Stalwarts are companies such as Coca-Cola, Bristol-Myers, Procter & Gamble, Hershey’s, Ralston Purina and Colgate-Palmolive. These multibillion-dollar hulks are not exactly agile climbers, but they are faster than slow growers.”
Stalwarts are an important category for retired investors and dividend growth investors. Many of the Dividend Aristocrats and Dividend Champions are found in this category. However, as Peter Lynch pointed out, stalwarts will not necessarily produce high growth, but most of the companies in this category would be considered blue chips. Nevertheless, quality often comes at premium valuations. Therefore, it can be difficult to find stalwarts at attractive values.
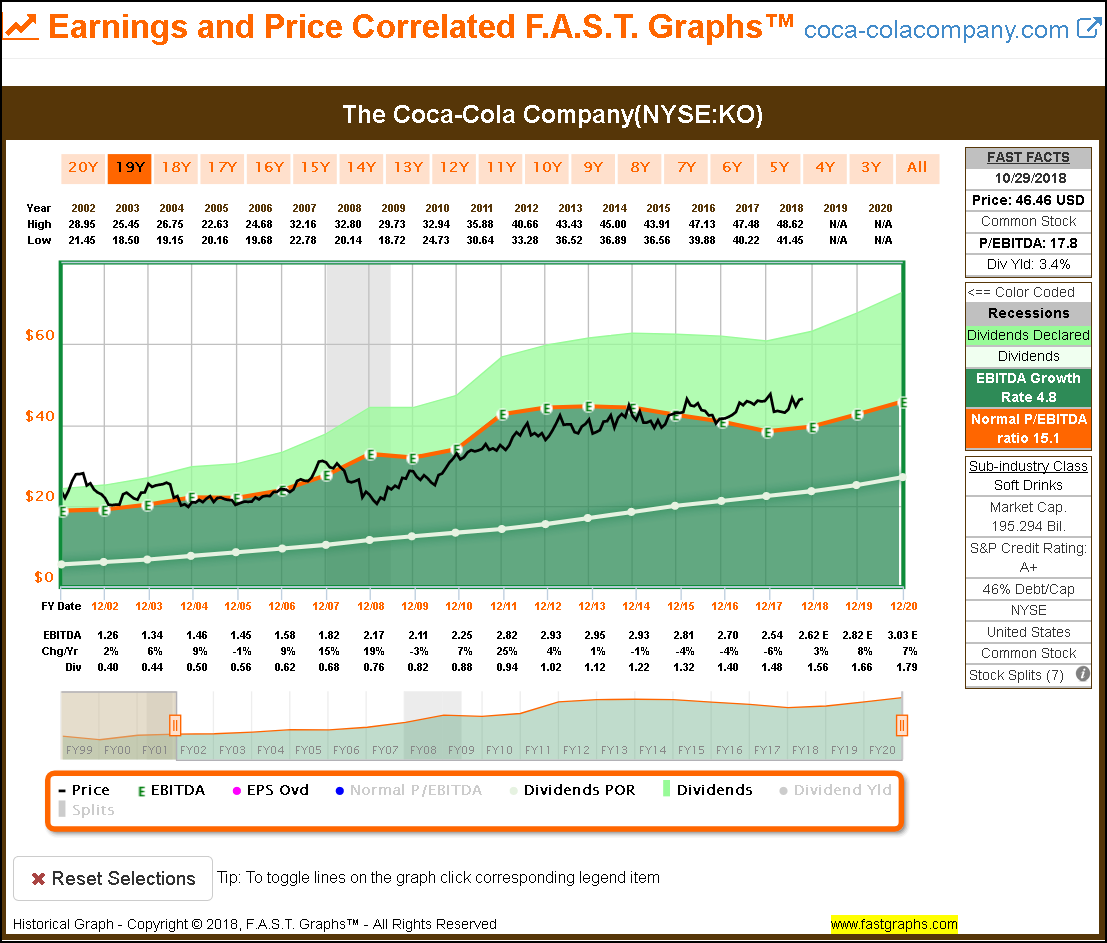
The Coca-Cola Company: A Classic Stalwart
With my first screenshot on Coca-Cola (KO), I review it based on its price and earnings correlation. The reader should note that Coca-Cola has historically commanded a premium P/E ratio valuation by the market (the blue normal P/E ratio line on the graph).
(Click on image to enlarge)

With this second screenshot, I evaluate Coca-Cola’s stock price relative to EBITDA and discover a very high correlation. However, the primary purpose of providing the screenshots is to provide insights into what makes up a stalwart as Peter Lynch described.
(Click on image to enlarge)
The Fast Growers
“These are among my favorite investments: small, aggressive new enterprises that grow at 20 to 25% year. If you choose wisely, this is the land of the 10-40 baggers, and even the 200 baggers. With a small portfolio, one or 2 of these can make a career. Fast-growing company doesn’t necessarily have to belong to a fast-growing industry. As a matter of fact, I’d rather it didn’t”.
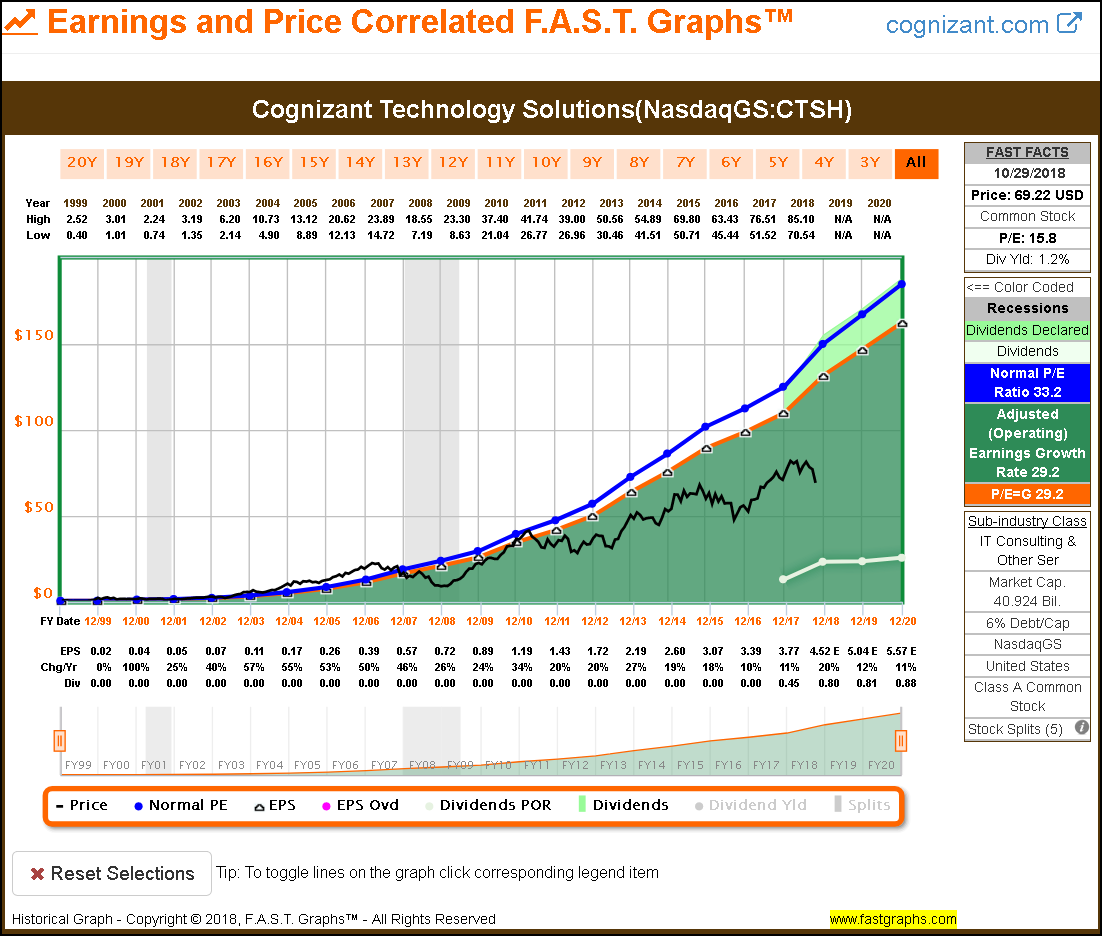
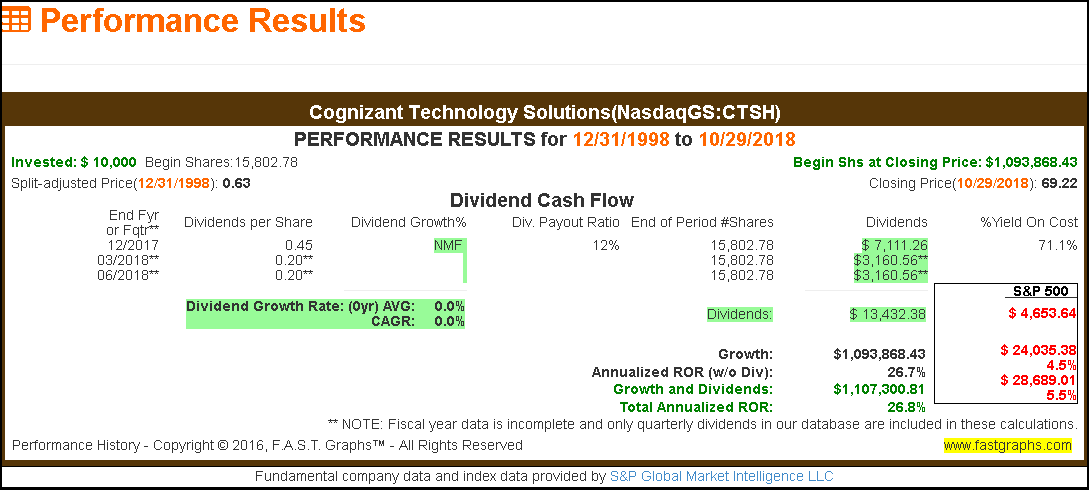
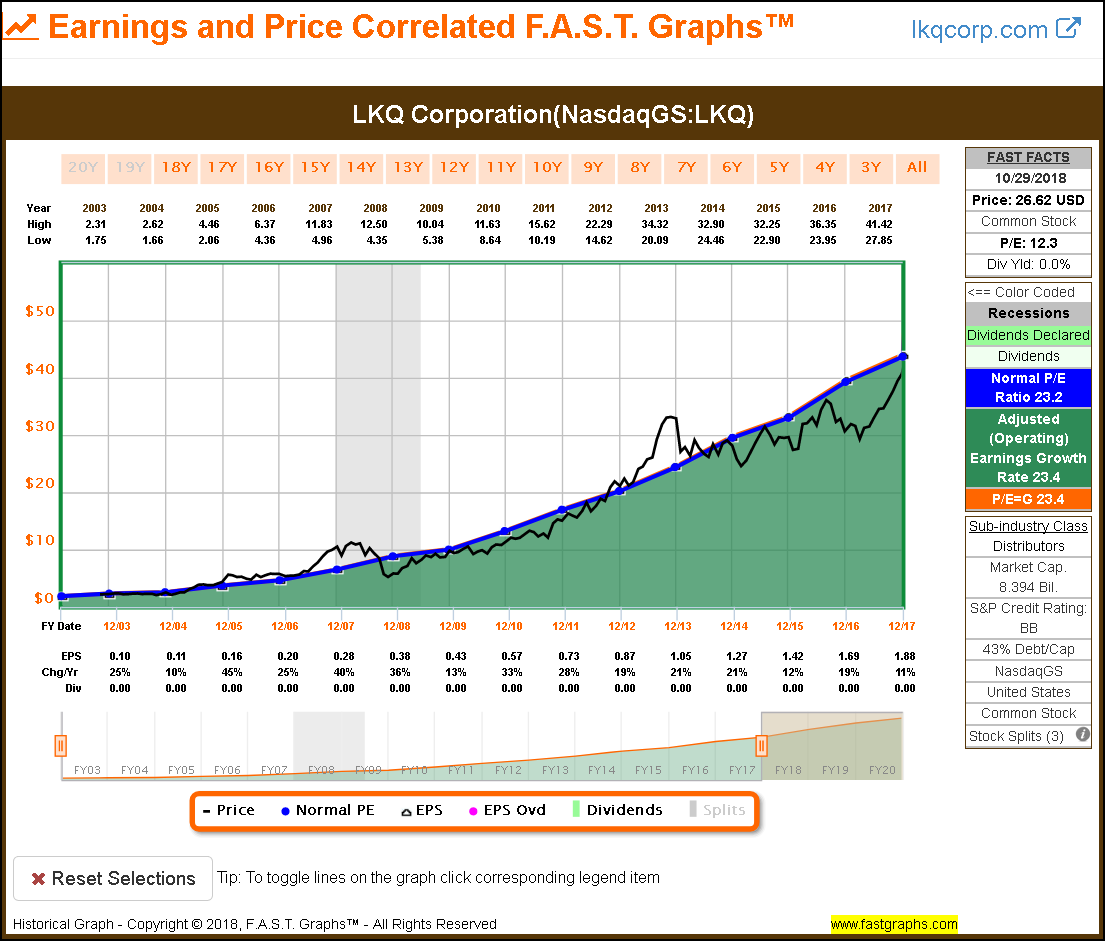
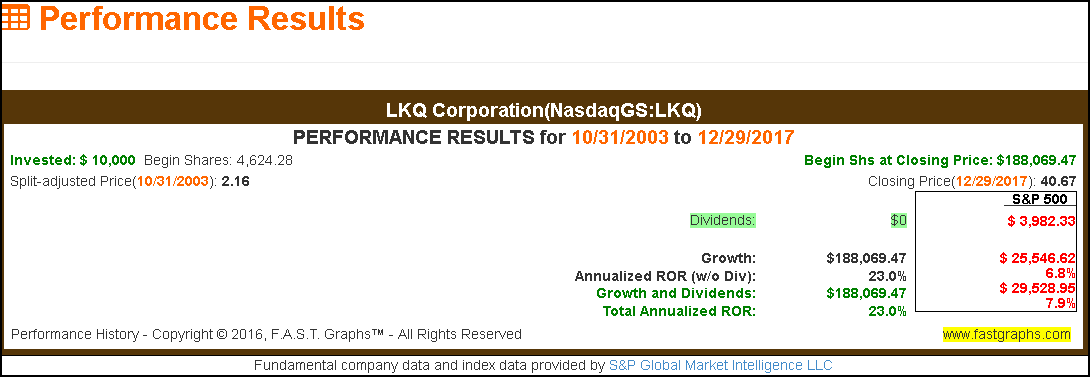
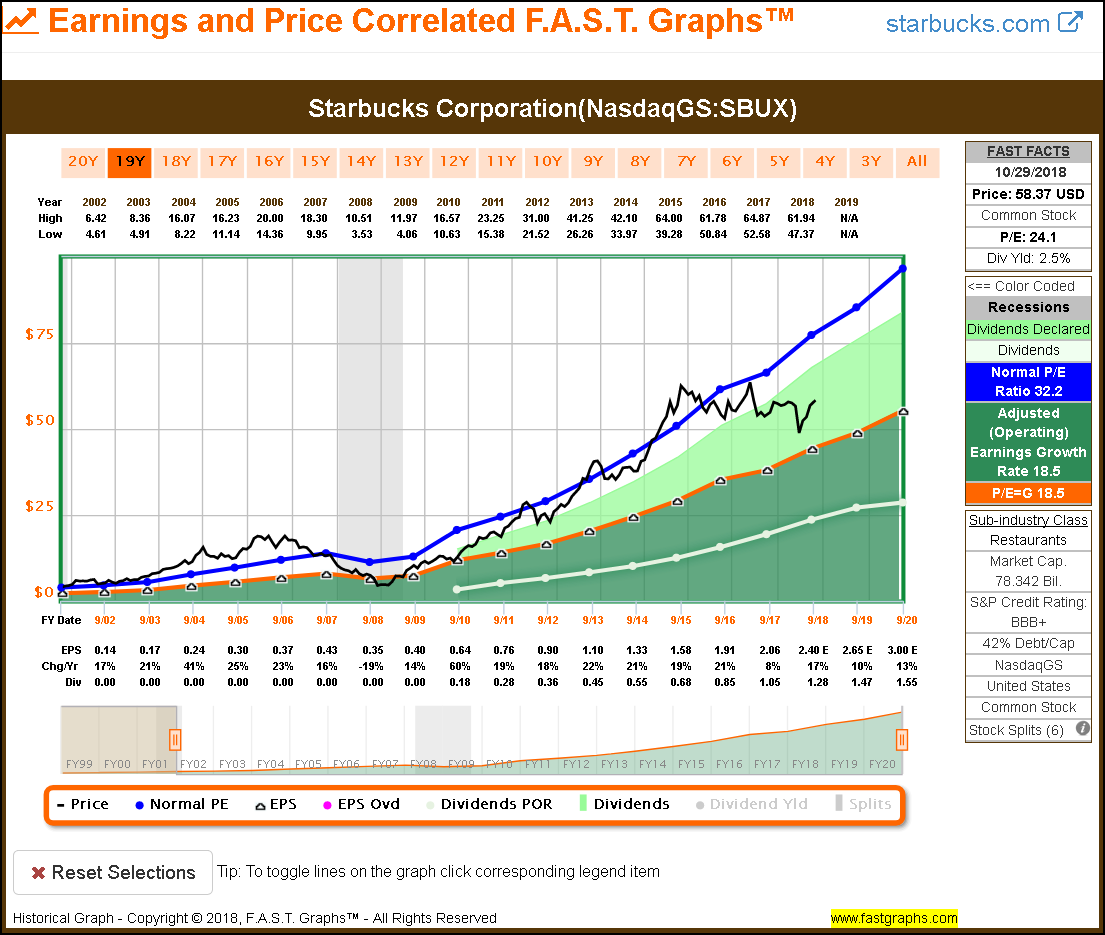
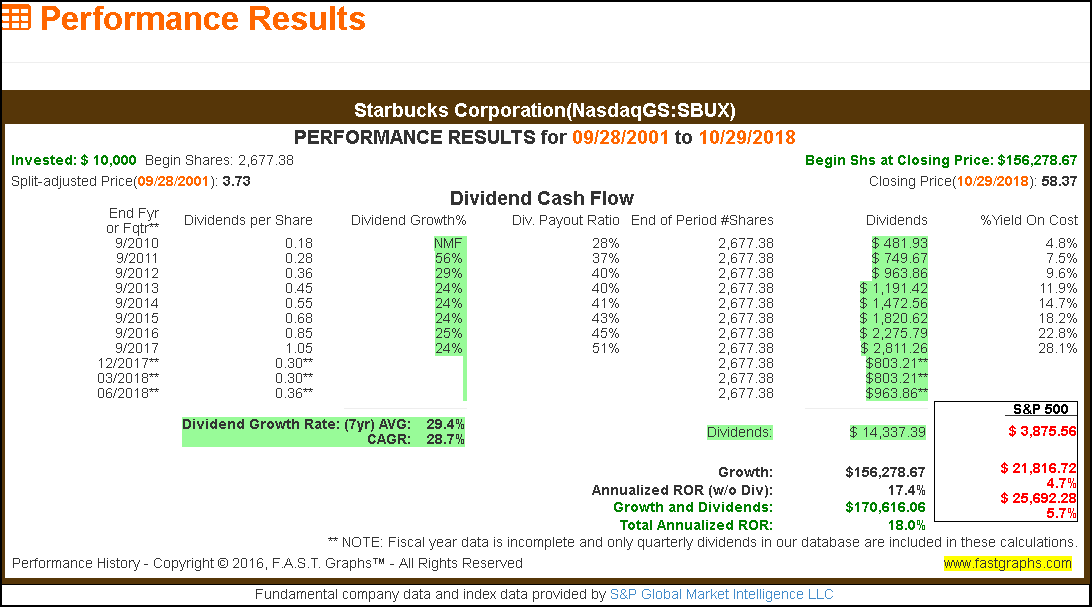
Although Peter Lynch did not mention any fast growers by name, I offer the following examples to illustrate the powerful returns possible with fast growers. Each of the three examples presented below met his criteria of a “10 bagger” or better. LKQ Corporation (LKQ) could classify as a smaller aggressive newer enterprise that grew at 20% to 25% a year, but Starbucks (SBUX) and Cognizant Technology Solutions (CTSH) are currently large-cap behemoths because of their extremely high historical earnings growth thus far (The reader should note that I stopped the LKQ graph at 2017 because the company is currently significantly undervalued relative to its historical growth).
I will let the F.A.S.T. Graphs and associated performance results on each stand on their own. The key points the reader should focus on are the historical earnings growth rates and the long-term returns that each have produced. However, it should also be noted that LKQ never paid a dividend and all its return has resulted from capital appreciation over time. Furthermore, Starbucks and Cognizant Technology Solutions are recent dividend payers, therefore, most of their returns are also attributed to capital appreciation as growth stocks.
(Click on image to enlarge)
(Click on image to enlarge)
(Click on image to enlarge)
(Click on image to enlarge)
(Click on image to enlarge)
(Click on image to enlarge)
The Cyclicals
“A cyclical is a company whose sales and profits rise and fall in regular if not completely predictable fashion. In a growth industry, business just keeps expanding, but in a cyclical industry it expands and contracts, then expands and contracts again. The autos and the airlines, the tire companies, steel companies, and chemical companies are all cyclicals. Even defense companies behave like cyclicals, since their profits rise and fall depends on the policies of various administrations”.
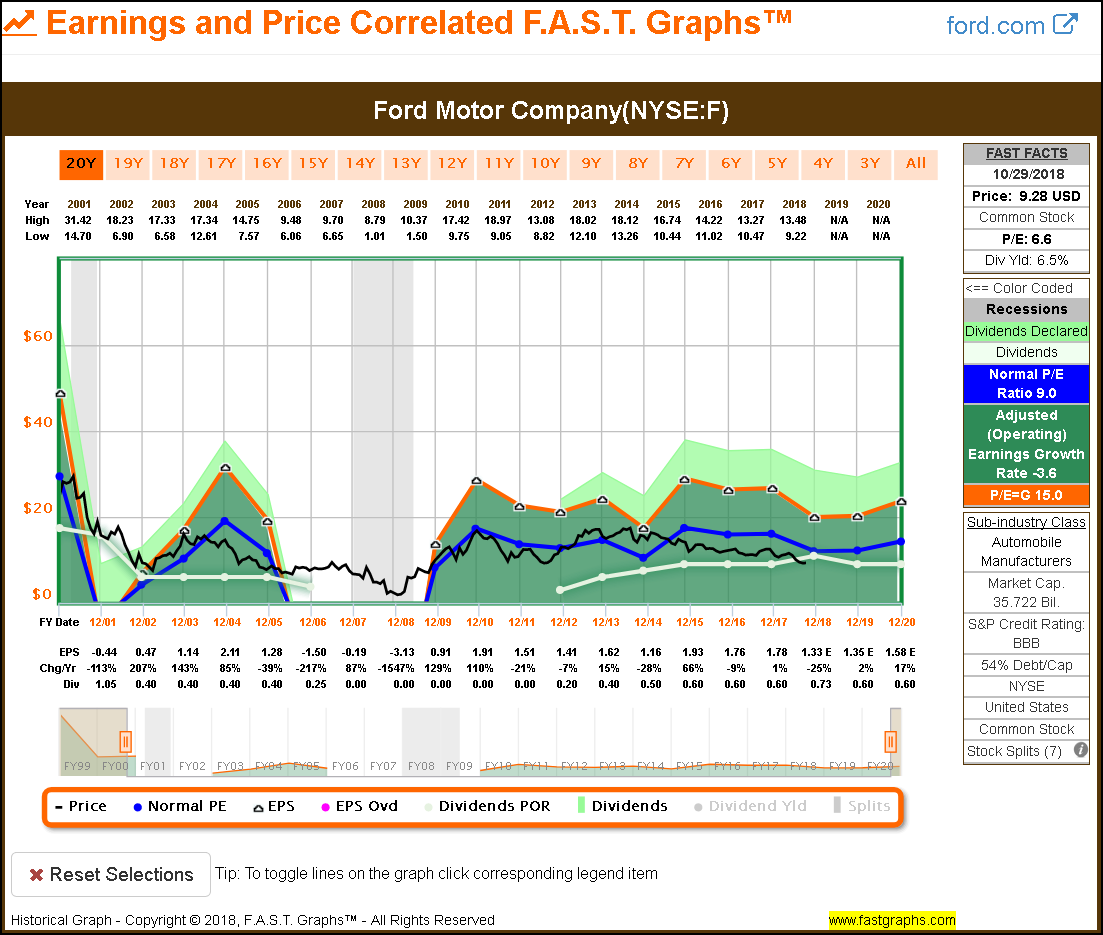
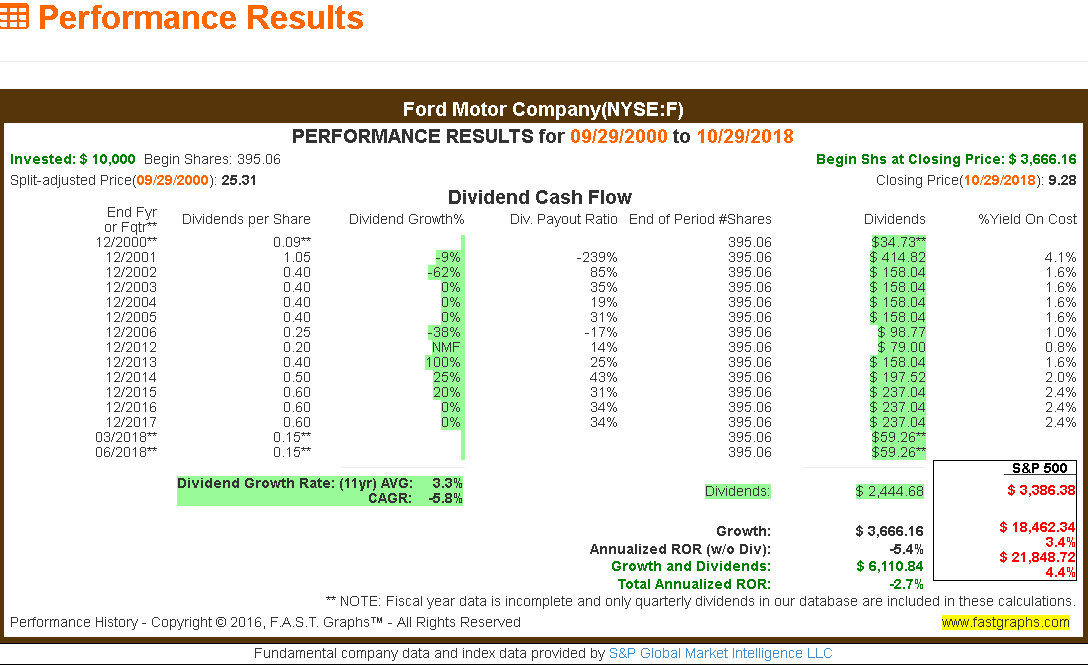
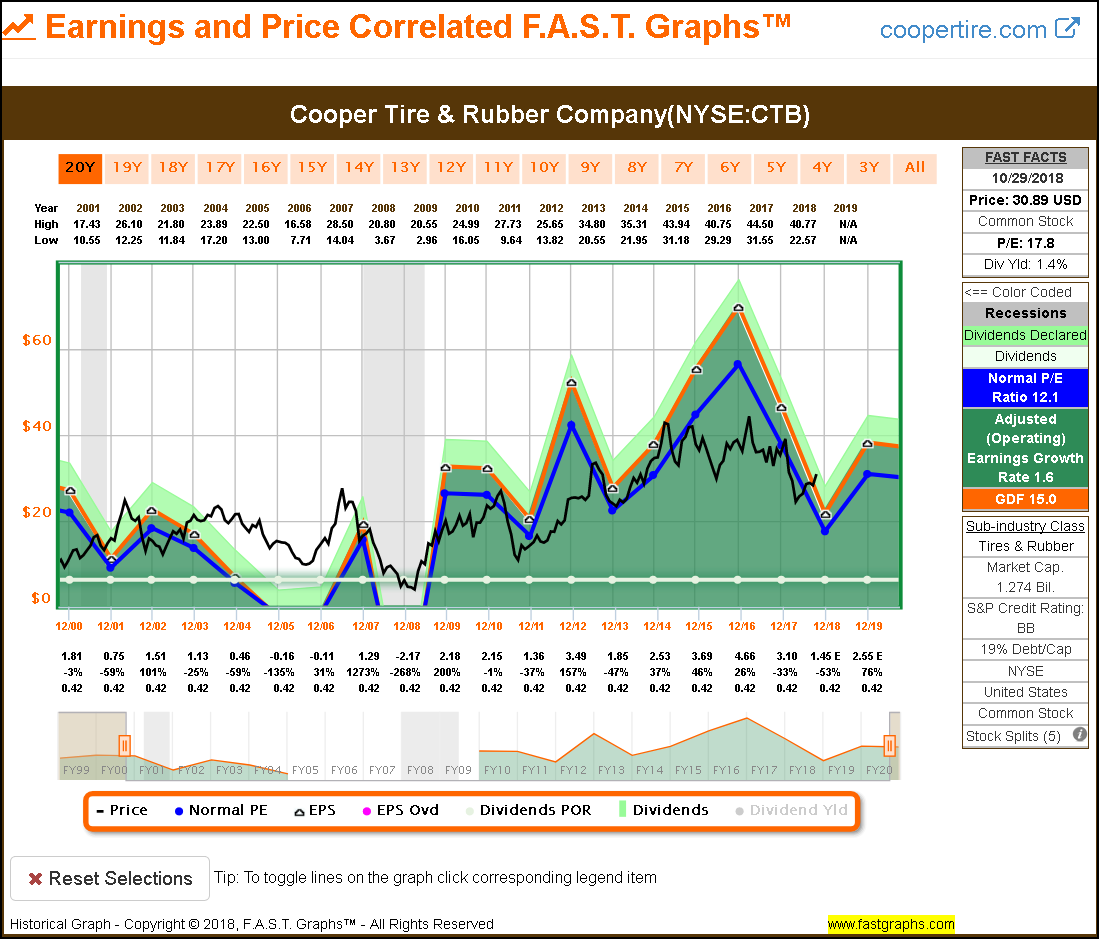
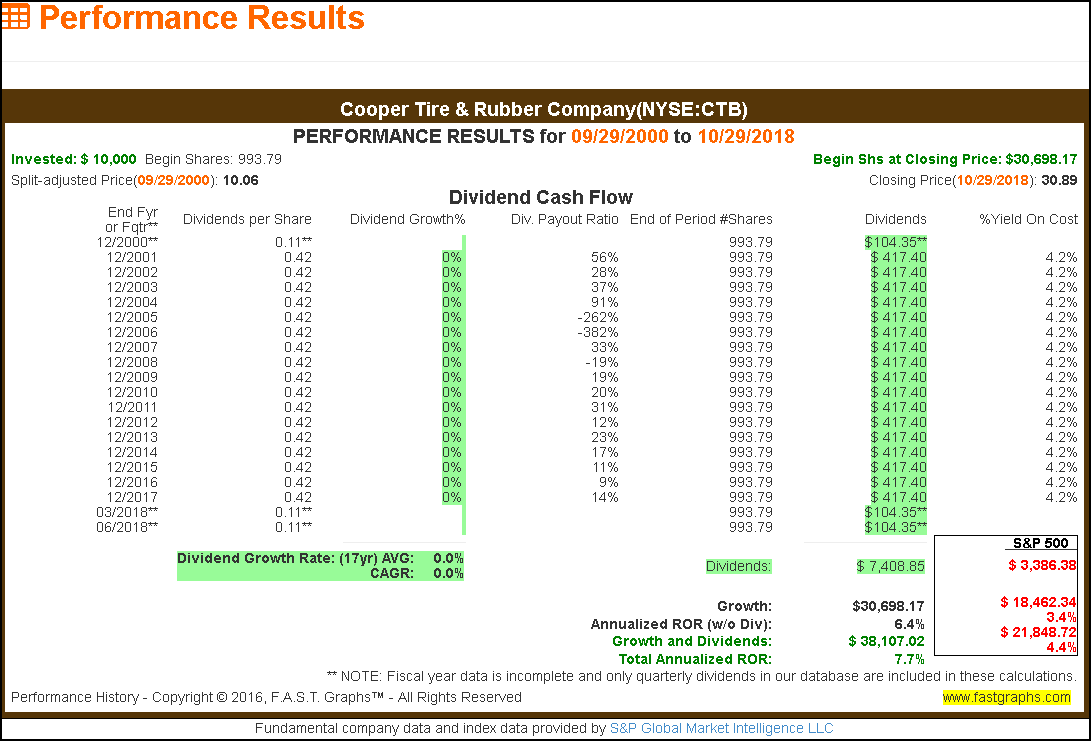
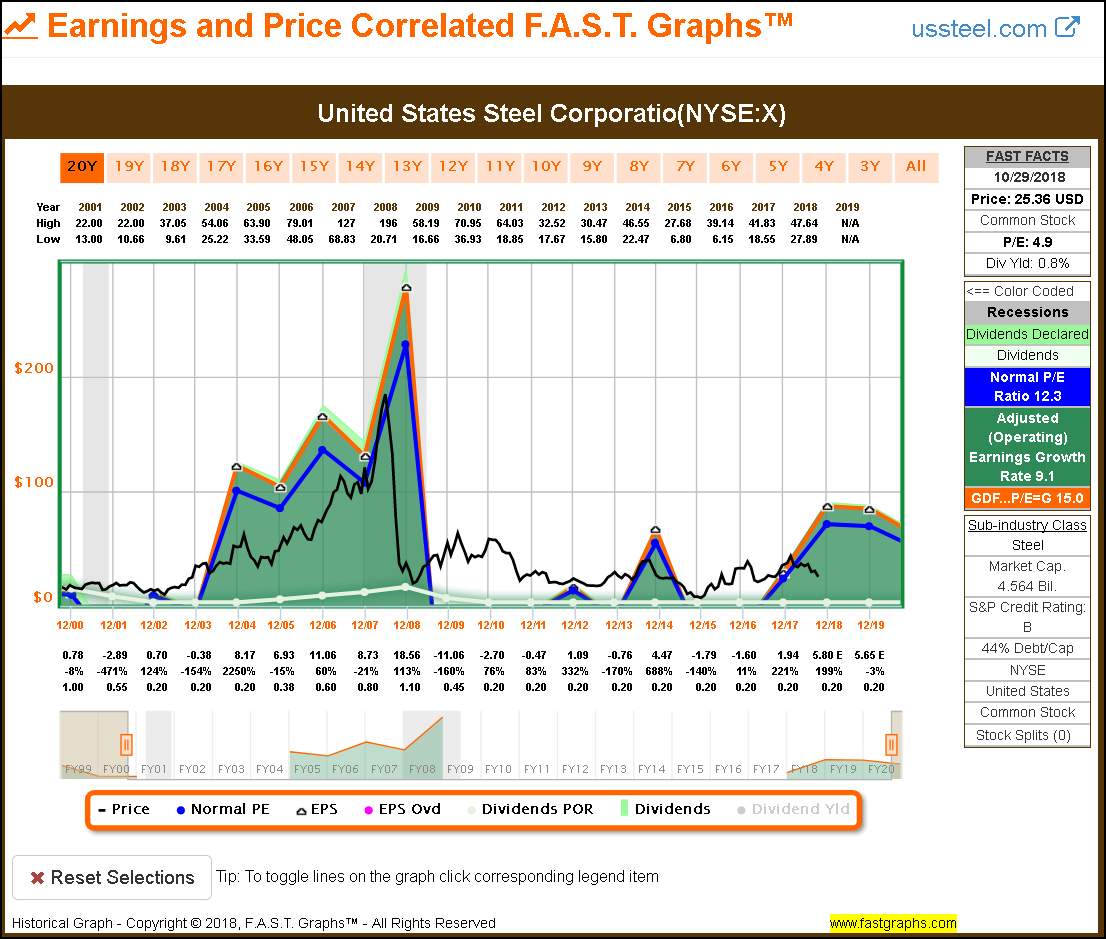
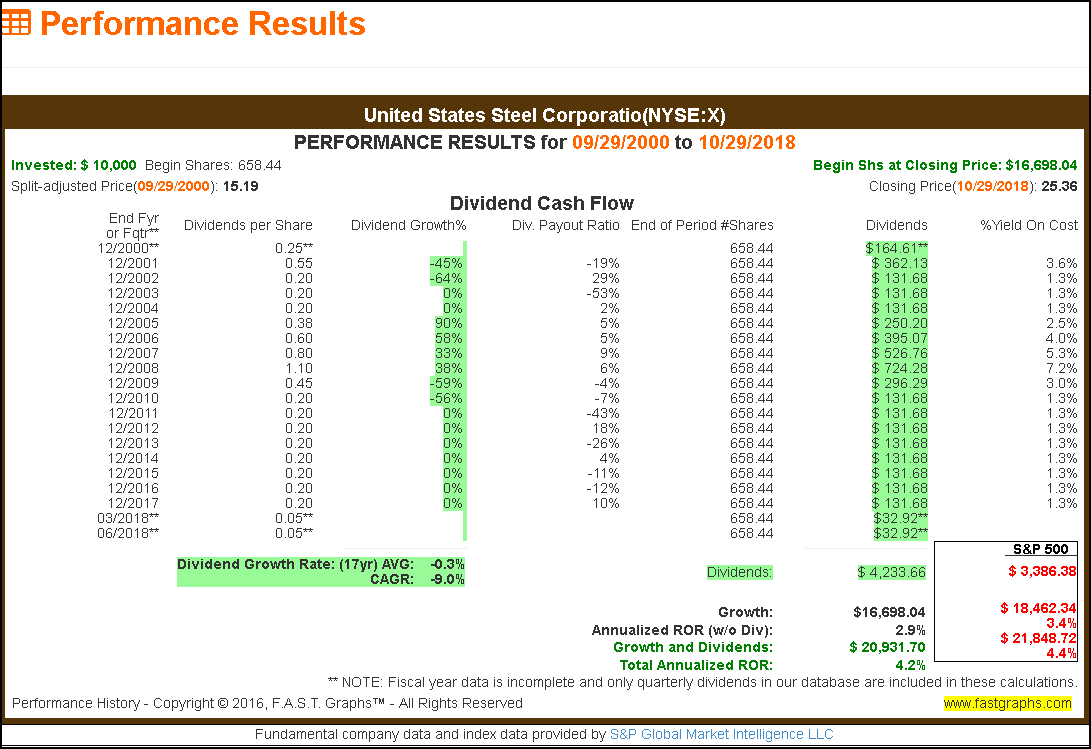
When examining the following graphs on well-known cyclicals in the autos, tire and steel sector, we see classic examples of what Peter Lynch meant when he said, “profits rise and fall in regular if not completely predictable fashion”. The associated performance reports of each of these first three examples illustrates the unpredictable nature of investing in them.
Consequently, I would like to share with the reader that I personally do not invest in what I call true cyclicals. As a long-term buy-and-hold investor, I prefer companies with more consistent histories of growth of both capital and dividends. The key word here is consistency. However, I have and currently do invest in semi-cyclicals such as United Technologies, Boeing or Home Depot. In other words, I personally make a distinction between a deep cyclical like the examples below versus what I call quasi cyclicals.
Most importantly, as you examine the historical earnings and price correlated graphs and subsequent performance on each of these 3 cyclical stocks, the unpredictable nature of their operating performance is what troubles me most. It might come as a shock to some that Ford Motor Company (F) has generated a negative long-term rate of return since fiscal year 2001. Nevertheless, a careful examination of Ford’s operating history illustrates why that has been the case. After the Ford example, you will see Cooper Tire & Rubber Company (CTB) and United States Steel Corporation (X).
(Click on image to enlarge)
(Click on image to enlarge)
(Click on image to enlarge)
(Click on image to enlarge)
(Click on image to enlarge)
(Click on image to enlarge)
Turnarounds
“Turnaround candidates have been battered, depressed, and often can barely drag themselves into Chapter 11. These are slow growers; these are no growers. These aren’t cyclicals that rebound; these are potential fatalities. Turnarounds stocks can make up lost ground very quickly… The best thing about investing in successful turnarounds is that of all the categories of stocks, their ups and downs are least related to the general market”.
In addition to cyclicals, turnarounds are another category that I personally eschew. Simply stated, they are just not my cup of tea. However, as Peter Lynch pointed out, they can be excellent hedges to the general market and significant short-term return generators. Consequently, and in all fairness, there are certain investors that can find turnarounds as attractive short-term opportunities.
Bank of America Corporation
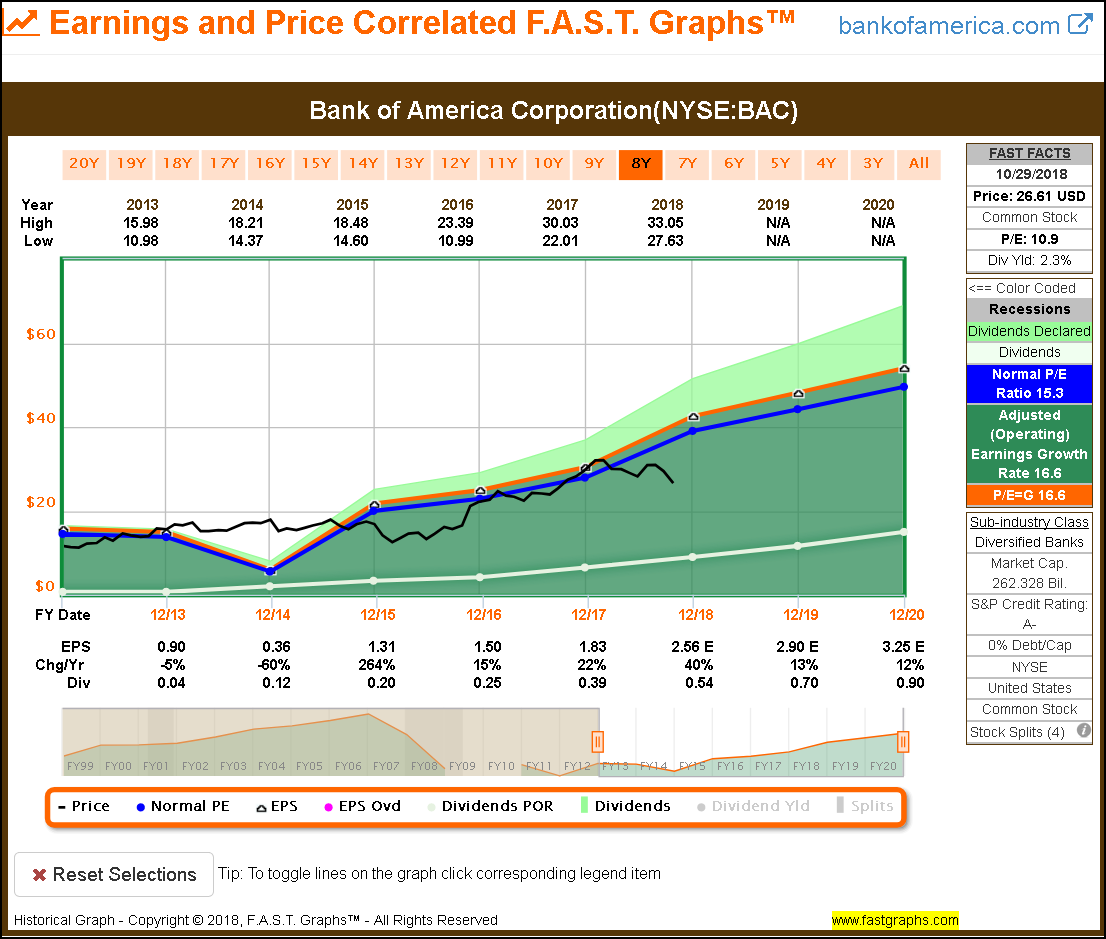
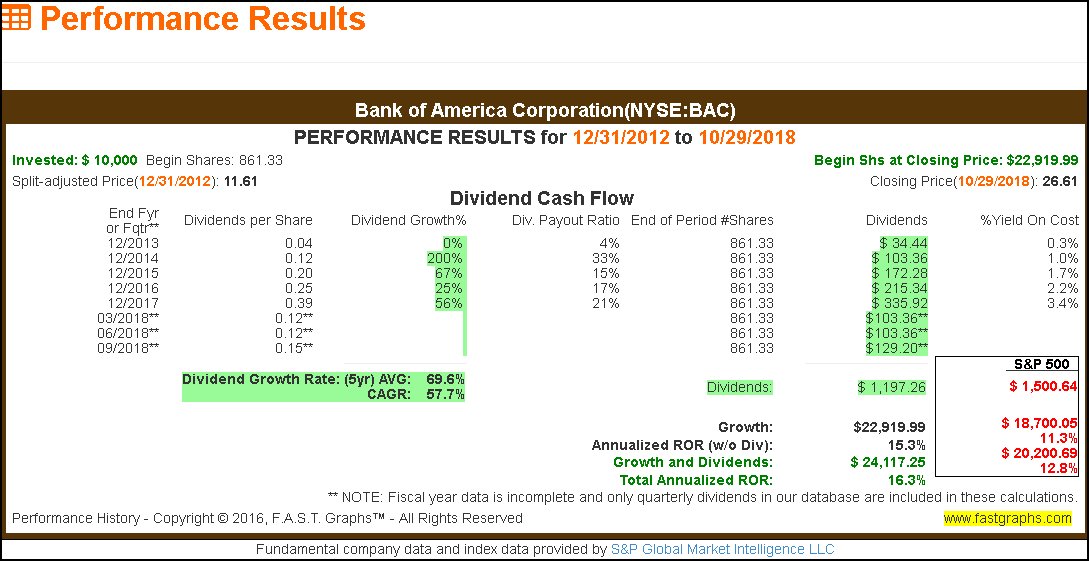
Bank of America (BAC) is a case in point after collapsing due to exposure of the housing-crisis-generated great recession, the company has recovered. However, they are still far away from returning to pre-great recession highs.
(Click on image to enlarge)
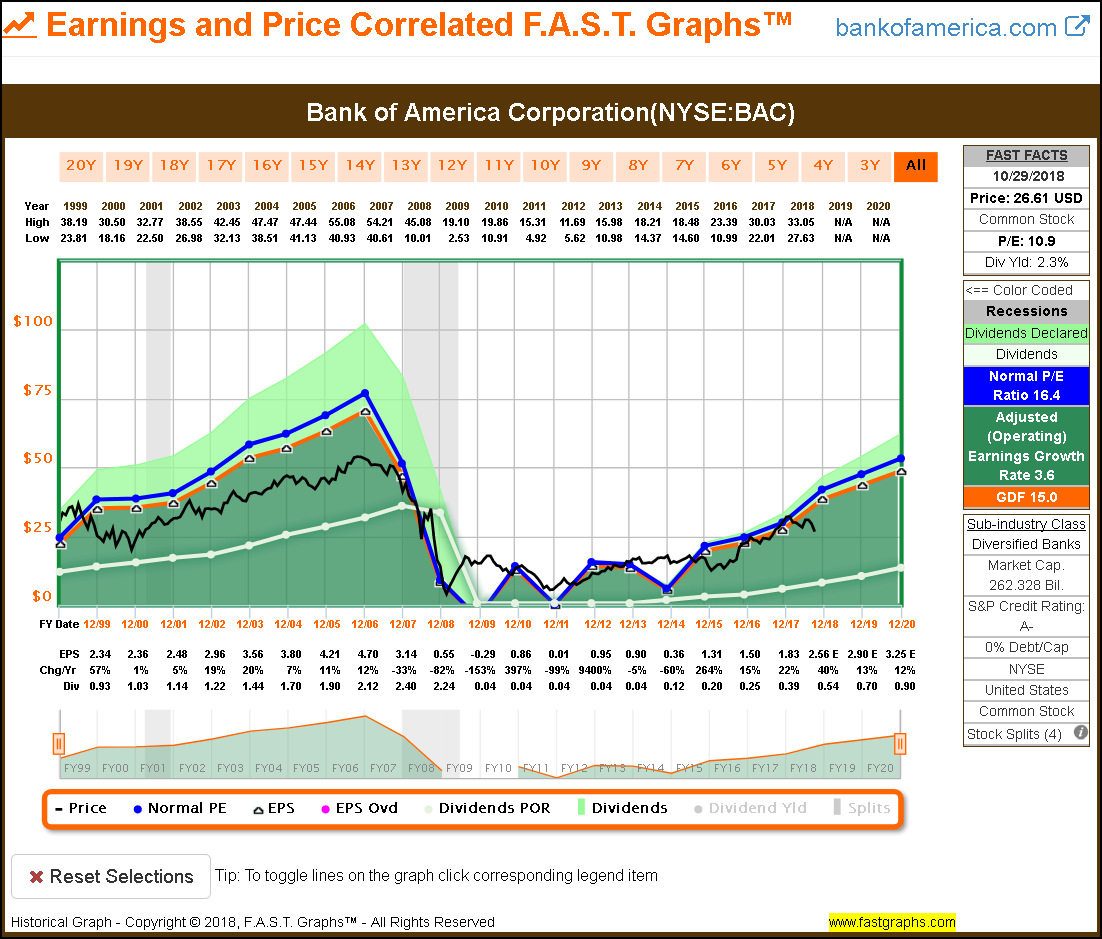
Bank of America’s earnings growth and performance results have been market-beating since 2012. The company is still A- rated and appears to be back on the growth path. However, do not let the 0% debt to capital reported on FAST FACTS fool you. Banks utilize debt as product, and therefore, their debt to capital ratios are not reported.
(Click on image to enlarge)
(Click on image to enlarge)
Avon Products Inc.
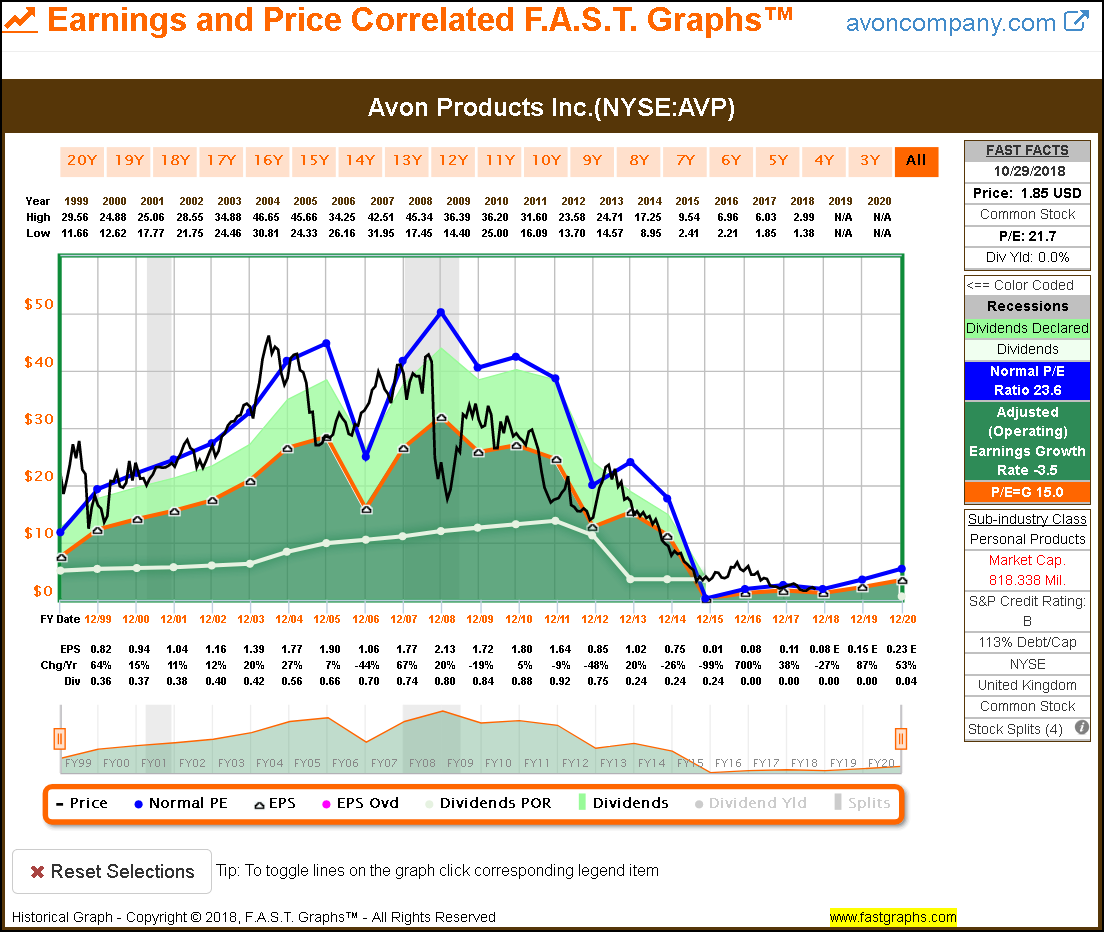
Avon (AVP) is a classic example of a turnaround as described by Peter Lynch. However, the jury is still out as to whether the company will survive and/or even begin growing again.
(Click on image to enlarge)
The Asset Plays
“An asset play is any company that is sitting on something valuable that you know about, but that the Wall Street crowd has overlooked. The asset play may be as simple as a pile of cash. Sometimes its real estate”.
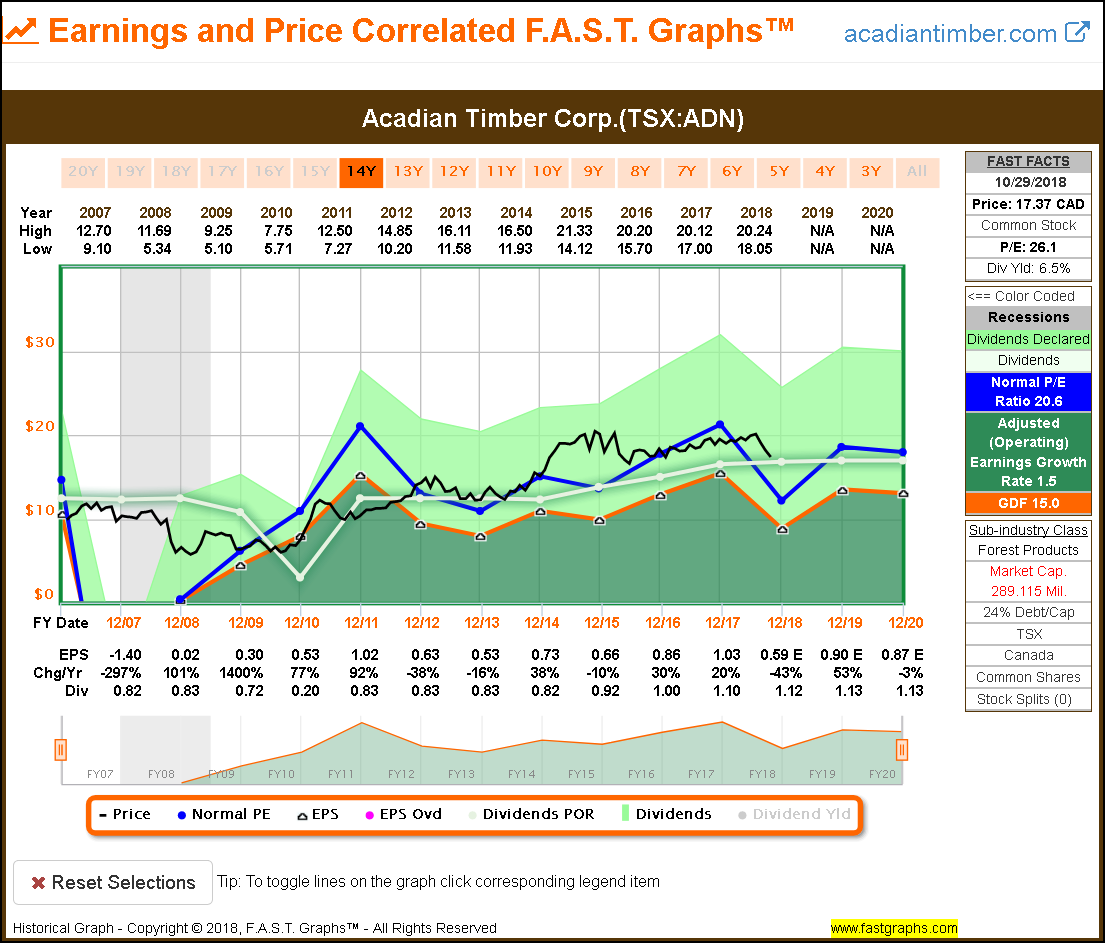
Although asset plays are clearly a category, I personally don’t consider them as relevant or important as Peter Lynch obviously did. The central idea about an asset play is that there is significant hidden value based on the assets that the company is sitting on. For example, the Acadian Timber Company (TXN: ADN) controls millions of acres of land and timber. However, from an operating earnings or operating cash flow basis, the company has only been an average performer. Whether or not the value of the assets can be unlocked becomes a critical consideration. In other words, I consider asset plays rather speculative.
(Click on image to enlarge)

(Click on image to enlarge)
Bonus: FAST Graphs Analyze out Loud Video on Peter Lynch’s 6 Categories
Video Length: 00:11:30
Summary and Conclusions
In this part 2 on stock selection, I have simply presented the six broad categories that investors have to choose from based on what Peter Lynch wrote about in his best-selling book. It’s important to state that investors could, in theory, construct a fully diversified common stock portfolio by only using companies from one of the six broad categories. For example, a diversified portfolio of dividend growth stocks could be created utilizing stalwarts only.
Nevertheless, the primary objective of this part 2 of a series on stock selection was to illustrate the broad categories available for common stock investors to choose from. In that regard, this article was oriented towards developing a clearer understanding of the types of companies available to various classes of common stock investors. Moreover, this article was also designed to illustrate the vast differences there are among the six categories of common stocks. This supports my continuing contention that it is a market of stocks and not a stock market.
In part 2B, I will discuss sector allocation strategies. I believe it’s important to understand that each sector can include companies across many of the broad categories. In other words, consumer staples can include stalwarts, cyclicals, fast growers, etc. Therefore, the reader needs to understand the distinction between a category of common stocks versus stocks included in various sectors.
Finally, I do owe my regular readers an apology of sorts. I had promised to include a screen of high-quality dividend-paying research candidates that are fairly valued in part 2.I still intend on providing that screen, however, it will not be produced until part 2B. The reason for this is that I did not anticipate the tremendous comment thread that occurred on part 1. As a result, I was inspired to modify this series. Therefore, I ask that regular readers be patient and wait for part 2B.
Disclosure: Long LKQ, CTSH.
Disclaimer: The opinions in this document are for informational and educational purposes only and should not be construed as a recommendation to buy or sell the ...
more


