
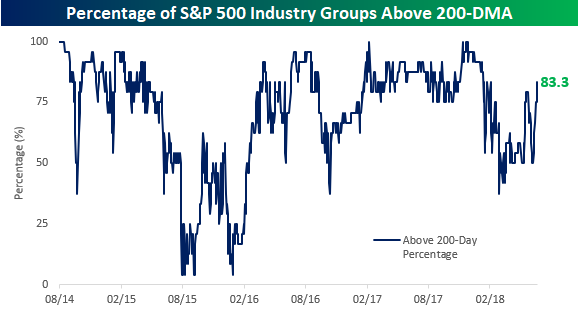
Number Of Groups Above 200-DMA On The Rise
When it comes to measuring market trends, one often used method of determining whether an index or security is in an intermediate to long-term uptrend or downtrend is to see whether or not it is trading above or below the 200-day moving average. The chart below tracks the percentage of S&P 500 Industry Groups trading above their 200-DMA over the last few years, and after a relatively sharp decline from well over 90% earlier this year, we’ve seen a strong rebound. In fact, just Friday, the percentage topped 80% for the first time since late February.
The table below lists each of the 24 S&P 500 Industry groups along with their YTD percent change as well as where each one is trading relative to its 200-DMA. Topping the list as of Friday’s close is Retailing, which is up over 30% on the year and is now more than 20% above its 200-DMA. Besides Retailing, the only other Industry Group more than 10% above its 200-DMA is Software & Services (13.32%), and the only other Industry Groups up over 10% on the year are Software & Services, Health Care Equipment & Svcs, and Tech Hardware. To the downside, not a single Industry Group is currently trading more than 5% below their 200-DMA, and only two are down more than 10% YTD (Household & Personal Products and Telecom Services). That compares to seven Industry Groups that are trading above their 200-DMA


Comments
 No Thumbs up yet!

