It’s Not The End Of The World, But…
Whenever we post an article that has arguments suggesting a negative outlook based on recent trends and indicators, we receive criticism from readers who are very bullish on stocks and claim anything negative is doom and gloom. Coincidentally, content containing negative developments receives the most attention which is ironic, as if people actually want bad circumstances to come to fruition. Our goal is neither to create clickbait content nor to have bias. All we want to know is what is really happening, and examine probabilities with which future events will occur.
Whenever we have positive or negative arguments dominating the story, we always try to examine both sides of the argument. The world is never one-sided black or white, and the truth generally happens to be in the middle with shades of gray. If you have a positive or negative outlook on something, you should welcome any disagreement because you can learn about a new risk you weren’t familiar with. It’s meaningless that stocks are in a record-long bull market. They actually fell 19.39% in 2011, proving that volatility isn’t gone even without a recession or technical bear market. To be clear, the calls for a recession every year get old, which is why we don’t do that. We stick to the facts and only make conclusions objectively.
Housing Burst Won’t Occur Again
As we have mentioned in other articles, the housing market has turned around in that it has become a buyers’ market because prices and interest rates have gotten out of hand. In a normal market there is price discovery and sometimes price growth falls. There’s nothing odd about that. The 2008 crisis was unusual because of the extreme speculation in housing and the lack of vetting by lenders.
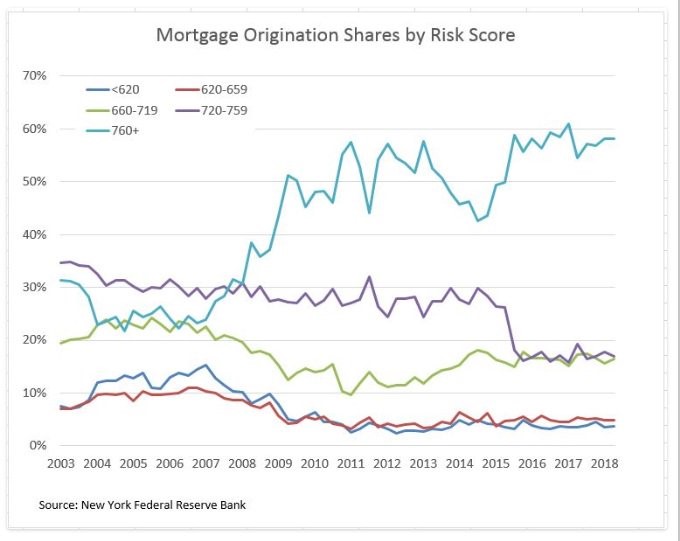
As you can see from the chart below, over 20% of the mortgage originations during the bubble era were given to borrowers with between a 660 and 719 credit score.
Source: NY Federal Reserve Bank
About 15% of mortgages in 2017 were given to borrowers with a credit score below 620. When prices fell and people lost their jobs, it’s not surprising that these borrowers, who put little money down, defaulted on their loans. Now almost 60% of mortgages are given to borrowers with a credit score above 760. Also, it's important to mention that housing market leverage is not at levels where it was in 2008, as we detailed previously. Certainly, some markets are overvalued, and some are in bubbles, but that does not mean real estate as a whole is in a bubble. In fact, our recent article shows that it’s not in a bubble. Something to point out though is that non-housing debt is a problem.
This housing crisis of 2008 was the worst possible combination as houses are many people’s biggest asset and speculation got out of control. Comparing this to cryptocurrencies, which as we examined previously resulted from record easy financial conditions in decades, is not an accurate comparison. Even though crypto speculation was possibly the greatest in an asset ever, there wasn’t a recession because it never was a big enough part of the economy to do damage.
Housing Market Tipping Point?
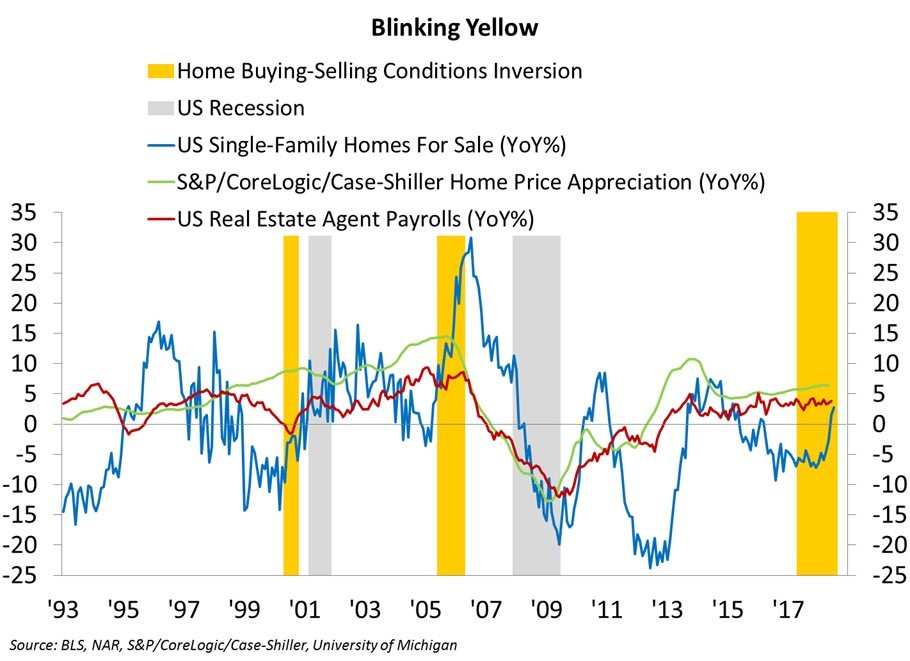
The chart below shows a few stats on housing. It includes the year over year sales in single-family homes, the S&P/CoreLogic/Case-Shiller year over year price appreciation, and when home buying conditions get worse than selling conditions.
Source: Twitter @LizAnnSonders
It’s interesting the way the phrases ‘buyers’ market” and ‘sellers’ market’ work because, at the beginning of a buyers’ market, it really isn’t a great time to buy a house; it’s just a great time to negotiate. In other words, the conditions have gotten so horrible for buyers that they can now negotiate. It doesn’t sound great when you phrase it that way.
The chart shows buying conditions have gotten bad right before recessions, which is bad now. It also means price appreciation will slow or prices will fall. Price growth has been steady ever since the recovery in the beginning of this expansion. Real estate payroll growth is strong now, but it could weaken if prices fall. Sales growth has been limited by supply, but it will soon be limited by demand if the buying conditions don’t improve.
Weak Regional Fed Reports
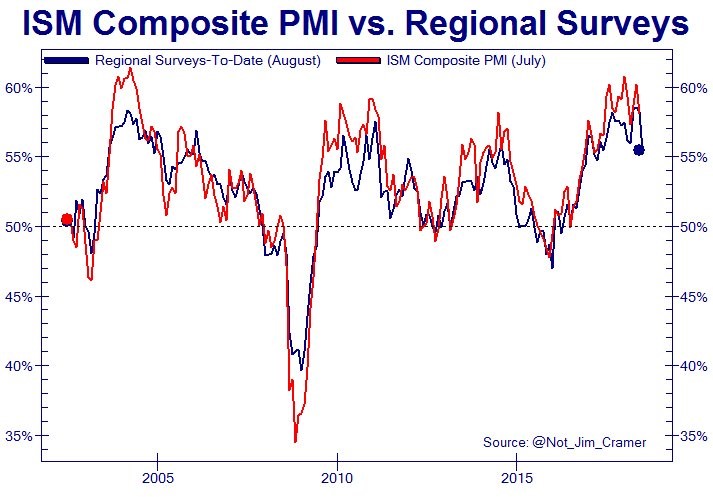
Two out of three of the regional Fed manufacturing reports were weak in August. This means the August ISM PMI will likely fall from July. According to the chart below, the PMI will be about 55 which means the manufacturing sector has gone from great growth to good growth.
Source: Twitter @Not_Jim_Cramer
The Kansas City Fed report had a headline reading of 14 which missed estimates and last month’s reading which were 23. The lowest estimate was 22, showing how disappointing this report was.
The Philly Fed manufacturing report was one of the first reports to show strength in 2016 as it was a leading indicator for strength. Now it is showing weakness as the headline was 11.9 which missed the consensus for 22.5 and last month’s reading of 25.7. The lowest estimate was 20. The Empire Fed report was the only strong one as it was 25.6 which beat the highest estimate for 22 and last month’s report of 22.6.
The August PMI flash reading was also weak as the composite fell from 55.9 to 55, the manufacturing index fell from 55.5 to 54.5, and the services index fell from 56.2 to 55.2. This report shows the implied pace of GDP growth fell from 3% in July to 2.5% in August. If growth is 2.5%, that would be a big decline from the 4.1% growth in Q2.
Russell 2000 Firms Vulnerable
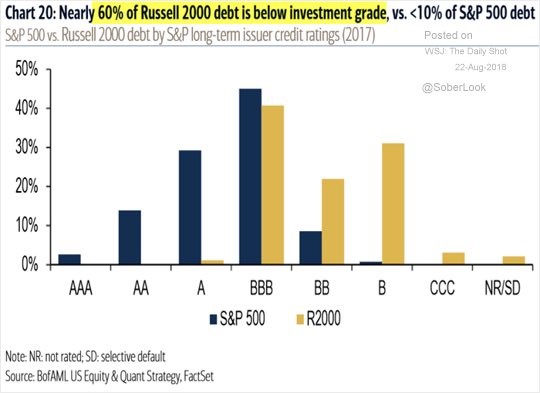
We showed in a previous article that the percentage of non-earners in the Russell 2000 is historically high at above 25%. Not only are they not making money, their credit ratings are also low. As you can see from the Merrill Lynch chart below, 60% of Russell 2000 firms’ debt is below investment grade as the most popular rating is BBB and the second most popular rating is B.
Source: Merrill Lynch
Less than 10% of S&P 500 debt is below investment grade because these are larger more mature firms. It’s worth noting that the S&P 500 is made up of small cap firms which have been more vetted than the ones in the Russell 2000. It could be a safer way to play small caps.
Chinese Earnings
It has been well documented that the Chinese economy is slowing. In fact, its a possibility we examined in January of 2018. The chart below is interesting because it shows as the CSI 300 is falling, the EPS are rising which is making the CSI 300 have nearly the lowest PE multiple since 2014.
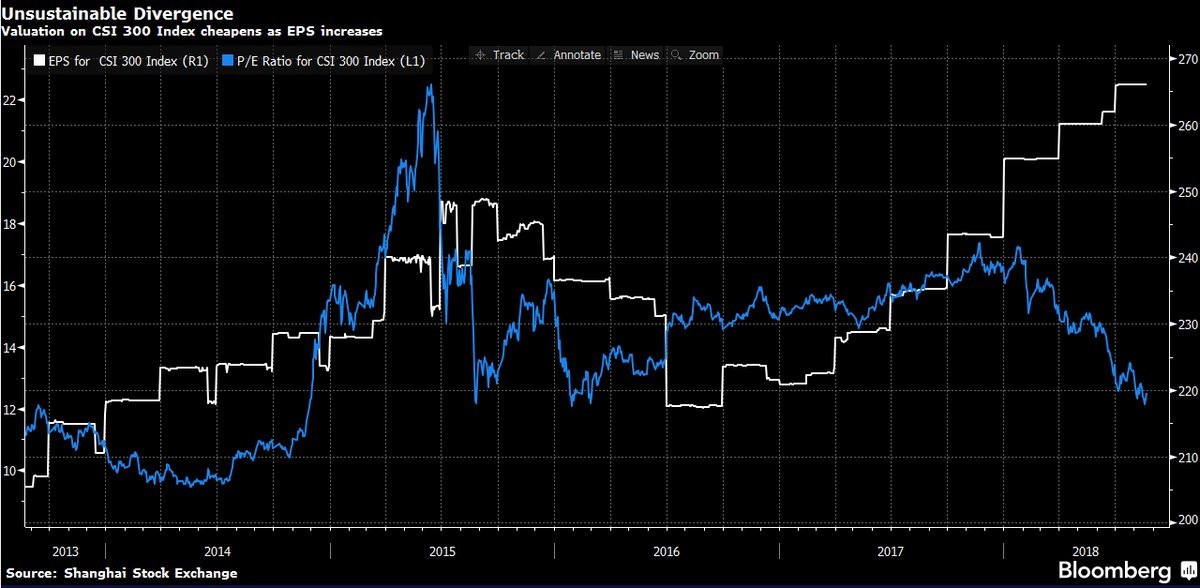
Source: Bloomberg
The one catch is that this decline could be a forecast that earnings will fall just like the decline in late 2014/early 2015 forecasted the earnings decline from mid to late 2015.
Conclusion
We try to show the bullish and bearish arguments. Since growth appears to be slowing from the Q2 rate of 4.1%, we need to talk about this. It doesn’t mean a recession is coming or a bear market is coming, but a correction and a slowdown are possible. Some investors don’t care about a 15% decline and some do. It seems like before the decline, everyone is positive and then after the decline, everyone wants to get out. It’s better to sell when there is euphoria than when there is panic.
Disclaimer: Please familiarize yourself with our full disclaimer here.


