Average Small Cap Stock In “Bear Market” Territory
Most people watching have noticed that the recent weakness in equities has been especially tough on the small-cap space, and another illustration of that trend is to look at the distance that stocks are currently trading from their 52-week highs. Within the large-cap S&P 500, the average stock is currently 13.2% below its 52-week high. Moving down the market cap spectrum, though, the numbers get progressively worse. In the S&P 400 mid-cap space, the average spread is 16.9%, while members of the S&P 600 Small Cap index are down an average of 20.7%. Using the standard bear market definition of a 20% decline from a high, the average small-cap stock is in a bear market!
(Click on image to enlarge)

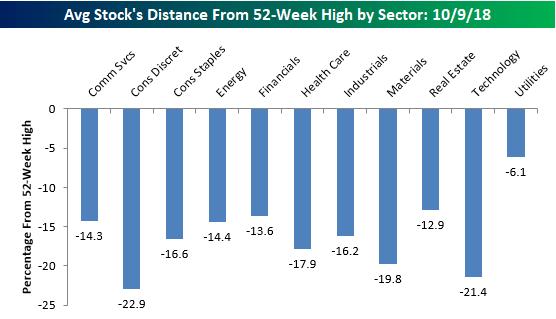
Looking at the spreads between current prices and 52-week highs, stocks in the Consumer Discretionary sector are further from their highs than any other sector (-22.9%), but Technology isn’t far behind at 21.4%. For two sectors that were market leaders, Tech and Discretionary have certainly seen a good deal of profit-taking lately. Outside of these two, other sectors where the ‘average’ stock has seen a pretty sizable pullback from its 52-week high include Materials (-19.8%), Health Care (-17.9%), and Consumer Staples (-16.6%).On the other end of the spectrum, Utilities (-6.1%) is the only sector where stocks are currently down by an average of less than 10% from their 52-week highs.
(Click on image to enlarge)

Disclaimer: To begin receiving both our technical and fundamental analysis of the natural gas market on a daily basis, and view our various models breaking down weather by natural gas demand ...
more


Small caps were supposed to benefit from tax cuts. What is going on?