A Strong Seasonal Trade On Home Builders Stares Down Fed Rate Hikes
The core of the seasonal trade on home builders is closing out with a likely rate hike from the U.S. Federal Reserve.
On Wednesday, March 15th the market expects the U.S. Federal Reserve to hike its interest rate by a quarter of a basis point (.25%). Up until now, the rate sensitive housing sector has performed exceptionally (and surprisingly) well.

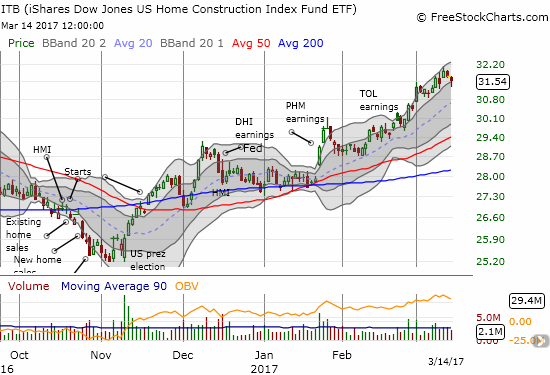
The iShares US Home Construction (ITB) stalled out for a month after the Fed’s December rate hike. Yet, it has rallied into March’s expected rate hike. ITB is up 14.8% year-to-date and has significantly out-performed the S&P 500 (SPY).
Source: FreeStockCharts.com
In December, 2015, I described the poor start to the seasonal trade. Sure enough, the seasonal trade for that 2015/2016 year turned into the worst since 2009. I was able to project the performance because of the typical pattern of the trade: a strong jump out the gate for the first few months and then a gradual, often choppy, decline into the summer in terms of annualized performance. By the Fall, the seasonal trade loses almost all its gas. This time around, ITB has stayed relatively strong throughout the trade thanks to a rally that launched right from the start of the season and took a pause just long enough to absorb the Fed’s December rate hike.
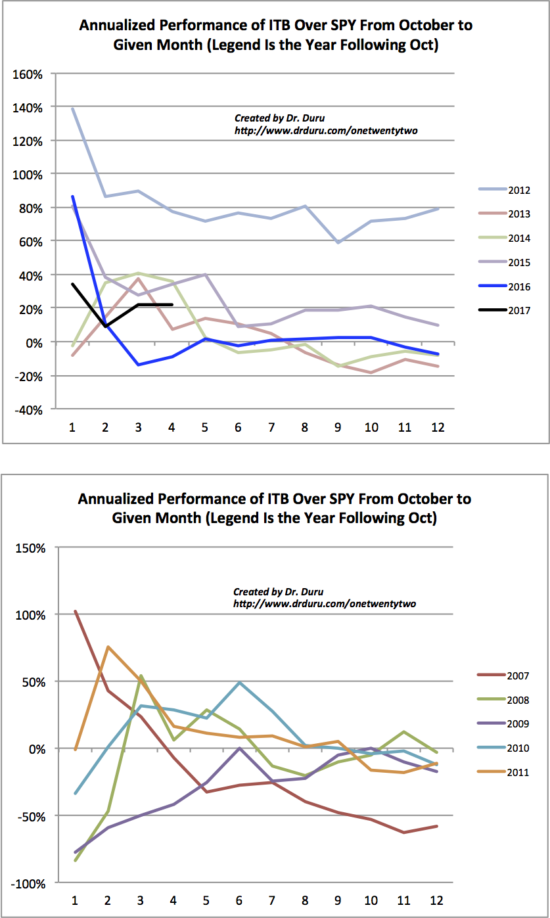
The year-to-date rally in iShares US Home Construction (ITB) has been quite impressive and has produced the second best seasonal trade since ITB started trading in 2007. The outperformance over the S&P 500 (SPY) is around middle of the pack since 2017. Through February (the fourth month of the trade), ITB has outperformed the S&P 500 (SPY) by 20 percentage points. Since the trough in housing in 2011, this season’s trade ranks fourth out of six seasons. The charts below divide out the years into pre and post-trough for readability. The x-axis is an index that counts the months in the seasonal trade which starts in November, month number 1. The y-axis is the difference in annualized performance in percentages between ITB and the S&P 500 (SPY). Each colored line is a different season. For example, the line for 2012 measures the November 2011 to October 2012 season.

The seasonal trade in ITB over the S&P 500 (SPY) tends to fade after the Spring selling season ends (index #6 is the performance from March to April)
Source of price data: Yahoo Finance
The 2012 season was by far the best as home builders raced off the 2011 trough which happened to occur in October of that year. The last season, 2015 to 2016, underperformed the S&P 500 for much of the season.
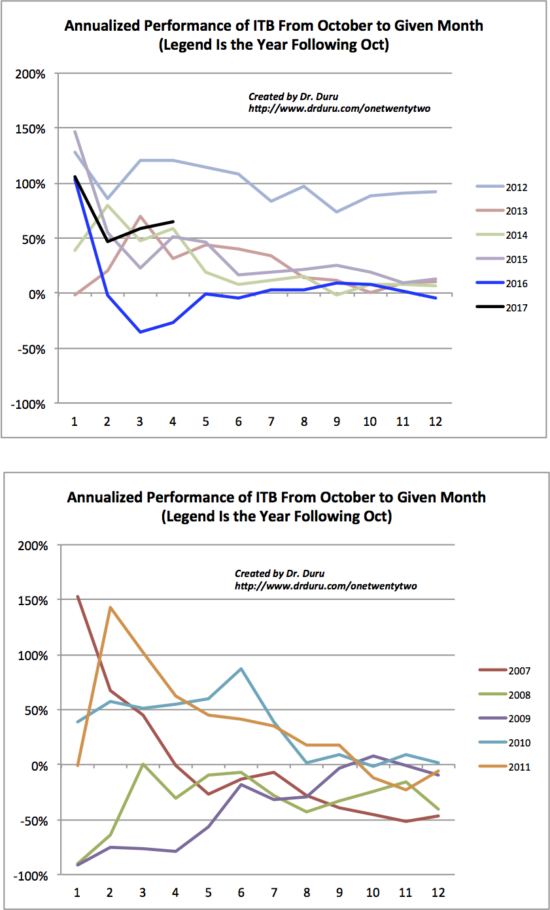
For perspective, here is the seasonal performance of ITB on its own…

The iShares US Home Construction (ITB) has not performed this well since 2012 (marginally better than 2011).
Source of price data: Yahoo Finance
The exceptionally strong performance of ITB caught me by surprise. As I explained in my Housing Market Reviews, I closed out my seasonal trade in ITB early expecting opportunities to buy dips going into the end of the seasonal trade. These dips never materialized, so I find myself under-invested in home builders the final months of this trade. As I noted, this situation is particularly surprising given what could have been perceived headwinds from Fed rate hikes. My most recent (re)addition to the portfolio was Century Communities which I explained in “Century Communities: Good Growth for A Cheap Price.” I now wait to see what opportunities the Fed rate hike brings…
Be careful out there!
Disclosure: Long CCS.
Follow Dr. Duru’s commentary on financial markets via more


