
3 Things: Take The Under, Bond Worries, Earnings Deception
I Will Take The Under
One of the biggest “lies” in the financial world is that if you just invest your money in the markets over the long-term, you will average 7, 8 or 10% a year. Just recently Myles Udland at Business Insider penned the following:
“From 1928 to 2014 the annualized return for the S&P 500 is about 10%. This is good. This would make achieving a 7% return seem pretty manageable.”
Here is the problem. Take a look at the following sequences:
Sequence 1) 7 + 7 + 7 + 7 + 7 + 7 + 7 + 7 + 7 + 7
Sequence 2) 7 + 10 + 10 + 15 + 12 + 8 + 10 + (-1) + (-4) + 3
Sequence 3) 7 + (-5) + (-5) + (-8) + 15 + 15 + 15 + 15 + 11 + 10
If you do the math, you will find that each of the sequences above average 7%.
“See, Myles is right”
Not so fast.
The mistake that the media, analysts, financial planners, etc. make is assuming that sequence (1) is the same as sequence (2) or sequence (3).
They are not the same.
Sequence (1) is a COMPOUNDED return. In other words, the investment of $1000 grows every year by 7%. The“power of compounding” is ONLY found in instruments that have two primary features – a return of principal function AND a stated return.
“Where do you find that?”
Bonds. Not stocks.
Sequence (2) and (3) reflect an AVERAGE return. As with the stock market, the return on a $1000 investment is affected by the increase/decrease of prices over time with no stated return. Ending results also greatly depend on when the drawdowns occur. Drawdowns at the end of the investing cycle are much less damaging than at the beginning.
Here is my point. There is a “Yuuuge” difference between COMPOUNDED and AVERAGE returns over long time frames. “Believe Me. Buh. Lieve. Me.”
The chart below shows a historical and forward projected series of variable rates of market returns averaging 7% annually.
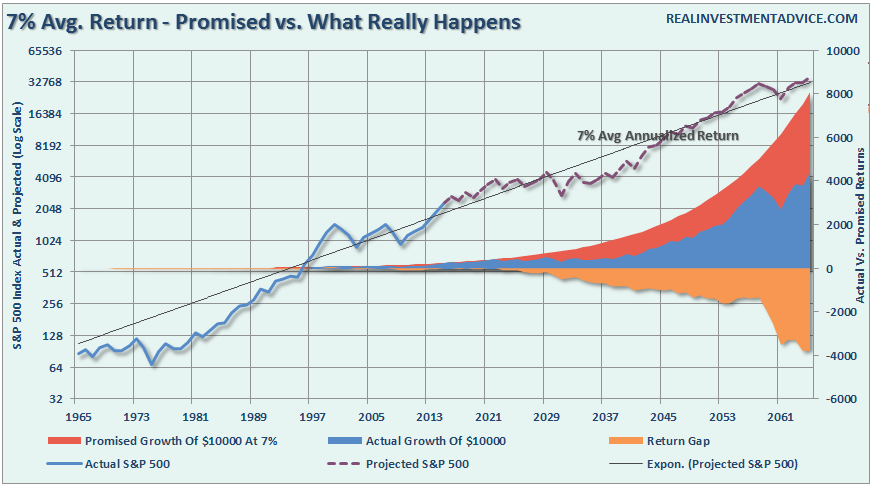
As you can see, the shortfall between a compounded return and an average return is significant. Just ONE negative year in given sequence of average returns creates a shortfall in the end result of a long-term financial plan.
Myles does give a nod to GMO on the “sequence of return risk:”
“A paper from last August out of GMO, however, notes that retirees face what is called “sequence risk” when it comes to their retirement, meaning that when you start and stop matters a lot.”
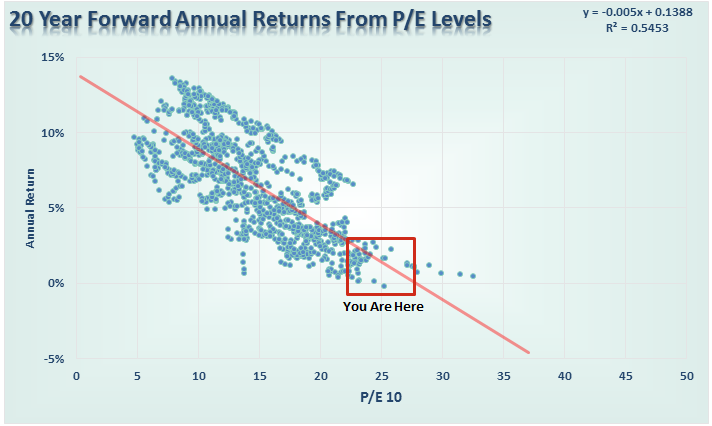
The problem is that Myles didn’t give it enough credence to the long-term effects of the “when” you start your investing cycle. The primary problem with the chart above is that investors DO NOT have 100-years to invest BEFORE their disbursement cycle begins. Unfortunately, with stock valuations pushing the second highest level in history, forward return expectations (before inflation, taxes, and expenses) are extremely low.
The next time that someone tells you to plan for an average 8% return over the next 20-years, tell them you “will take the under on that bet.”
Stock Bulls Better Pray Rates Don’t Rise
Bob Bryan recently penned an interesting piece quoting Robert Grossman at the credit rating agency Fitch Ratings.
“This year’s dramatic fall in yields on bonds issued by investment grade sovereigns has again raised the risk that a sudden interest rate rise could impose large market losses on fixed-income investors around the world. A hypothetical rapid reversion of rates to 2011 levels for $37.7 trillion worth of investment-grade sovereign bonds could drive market losses of as much as $3.8 trillion, according to our analysis.”
Whether you agree with this premise, or not, is largely irrelevant to this discussion. The current “bullish” mantra is the“great bond bull market is dead, long live the stock market bull.” However, is that really the case?
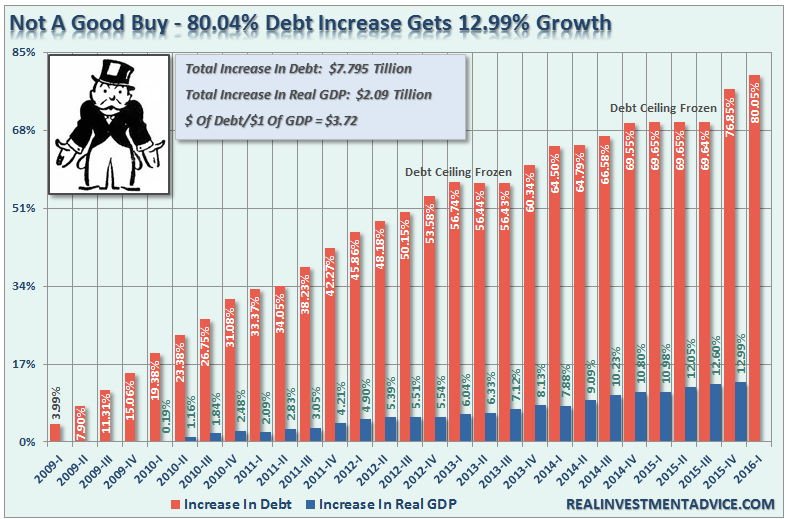
The common misconception is that if the bond bubble pops, and interest rates rise sharply, that stocks will continue to crank out 8% annualized rates of return. However, given the excess levels of debt currently required to finance $1 of economic growth, a spike higher in rates will not only have a vastly negative effect on bond holders, but the equity markets as well.
Debt is currently the lifeblood of the economy. Global Central Banks have been flooding the system with liquidity and buying bonds to artificially suppress interest rates to boost economic growth, and ostensibly equity prices, to foster confidence and consumption. By extension, a reversal of low interest rates would be the worst thing that could possibly happen.
1) The Federal Reserve has been buying bonds for the last 8-years in an attempt to push interest lowers to support the economy. The recovery in economic growth is still dependent on massive levels of domestic and global interventions. Sharply rising rates will immediately curtail that growth as rising borrowing costs slows consumption.
2) The Federal Reserve currently runs the world’s largest hedge fund with over $4 Trillion in assets. Long Term Capital Mgmt. which managed only $100 billion at the time, nearly brought the economy to its knees when rising interest rates caused it to collapse. The Fed is 40x the size and growing.
3) Rising interest rates will immediately kill the housing market taking that small contribution to the economy away. People buy payments, not houses, and rising rates mean higher payments.
4) An increase in interest rates means higher borrowing costs which leads to lower profit margins for corporations. This will negatively impact corporate earnings and the financial markets.
5) One of the main arguments of stock bulls over the last 8-years has been the stocks are cheap based on low interest rates. When rates rise the market becomes overvalued very quickly.
6) The massive derivatives market will be negatively impacted leading to another potential credit crisis as interest rate spread derivatives go bust.
7) As rates increase so does the variable rate interest payments on credit cards. With the consumer being impacted by stagnant wages and increased taxes, higher credit payments will lead to a rapid contraction in income and rising defaults.
8) Rising defaults on debt service will negatively impact banks which are still not adequately capitalized and still burdened by large levels of bad debts.
9) Many corporate share buyback plans and dividend issuances have been done through the use of cheap debt, which has led to increases corporate balance sheet leverage. This will end.
10) Corporate capital expenditures are dependent on borrowing costs. Higher borrowing costs leads to lower Capex.
11) Commodities, which are very sensitive to the direction and strength of the global economy, will plunge in price as recession sets in.
12) The deficit/GDP ratio will begin to soar as borrowing costs rise sharply. The many forecasts for lower future deficits will crumble as new forecasts begin to propel higher.
The problem with most of the forecasts for the end of the bond bubble is the assumption that we are only talking about the isolated case of a shifting of asset classes between stocks and bonds. However, the issue of rising borrowing costs spreads through the entire financial ecosystem like a virus. The rise and fall of stock prices has very little to do with the average American and their participation in the domestic economy. Interest rates, however, are an entirely different matter.
As is always the case, somebody is going to be very wrong.
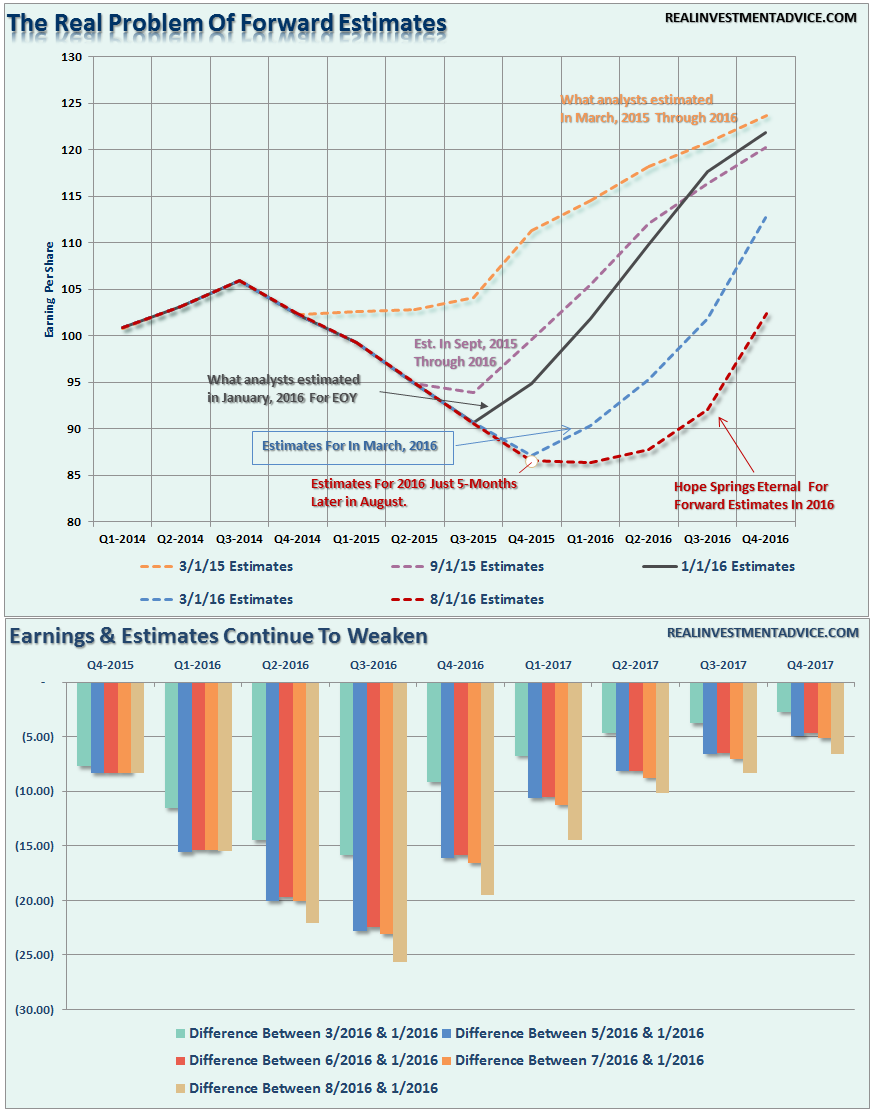
Earnings Deception
As we muddle our way through earnings season, we are once again being bombarded by the mainstream media about how many companies are “beating” their estimates. As I have written previously:
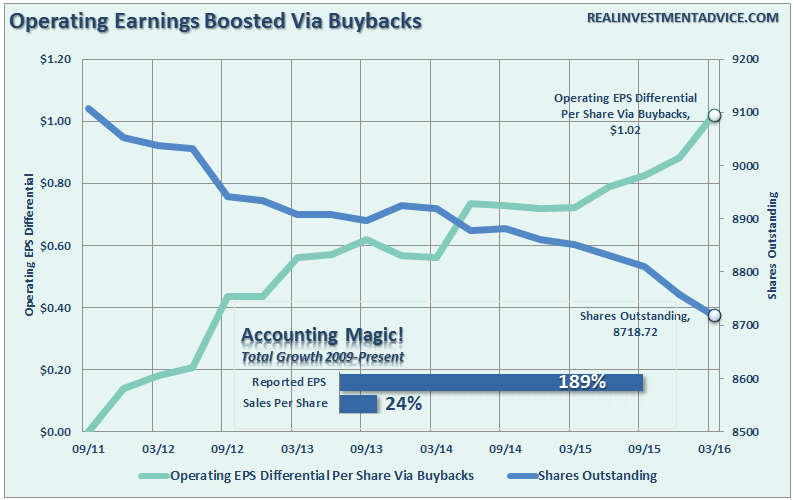
“As top line revenue growth has remained mired in a slow growth state, along with the economy, bottom line earnings per share have skyrocketed due to ongoing cost-cutting, wage suppression, and share buybacks. Q1 is currently estimated to show the largest differential in Operating EPS, as compared non-buyback adjusted Operating EPS, of $1.02.”
“What is interesting is when we take a look at the estimated Operating EPS for Q1 currently and compare that to the estimates for Q1 of 2016 in January of this year. Currently, Operating EPS for Q1 is expected to be $25.35 when in January it was estimated to be $28.05. If we back out $2.70 over-estimation error, the current beat rate for earnings is actually ZERO.
But, of course, that takes all the fun out of the ‘beat the earnings estimates’ game, doesn’t it?”
The situation is getting even worse in Q2.
- The number of outstanding shares in the S&P 500 has fallen again in Q2 from 8718.72 to just 8667.97 million shares. Which is another 0.5% reduction is outstanding shares. However, shares outstanding have fallen from the last peak in Q3 of 2011 by 4.81%.
- In just the last month forward earnings expectations have been reduced by another 8% well below where 2016 expectations were believed to be at the beginning of this year.
Here’s the point. When investors buy shares of a company, they are buying into an expected stream of future earnings and paying a “multiple” for those earnings. The problem investors face currently is the excessive value being paid for future expected earnings that are consistently overstated by as much as 33% historically.
These elevated expectations tie into all three parts of this missive. For investors banking on their investments to bail them out of under-saving for retirement, returns over the next 20-years will likely disappoint current expectations of 8% average rates.
Just some things I am thinking about.
Disclosure: The information contained in this article should not be construed as financial or investment advice on any subject matter. Streettalk Advisors, LLC expressly disclaims all liability in ...
more
Comments
 No Thumbs up yet!

