Hotel Industry Signals Recession; JOLTS Amazingly Strong
When reviewing industries, the information can add two separate layers of information Firstly, the research can help you understand specific industries and equities within those industries that are poised to provide the best returns. Secondly, it can give you a broader understanding of the macroeconomy.
You can’t allow your macroeconomic research to be the basis for your investment returns, especially if your investing focus is industry based or company specific. The good news is if you get the macroeconomic analysis correct, it increases your potential returns for the individual equities and industries that you choose to invest in. Macroeconomic analysis adds a layer to your research. Good investors figure out multiple ways for their investment to provide returns in a range of varying circumstances.
The risk is if your analysis is wrong, you can turn a good stock pick into a loser in the intermediate term. A great firm with a strong moat should do well in the long run, but buying at the best price is obviously always essential.
If you can’t do macroeconomic research, but really like an individual company, it’s best to avoid worrying about the economy. It’s better to do nothing than add poor analysis to your process. In an oversimplified example, this would be akin to if you did hours of research on why a semiconductor firm has a competitive advantage, but then didn’t buy it because of a half-baked thesis on rates moving up, and that theoretically being negative for equities. If you are investing yourself or other people’s money, you need to fully understand the risks and potential opportunity, instead of relying on research you didn’t fully understand, regardless of whether its bearish or bullish.
Restaurant Sales Growth Was A Failed Indicator
The second advantage of industry-based research is that it can provide a broader macroeconomic viewpoint. One industry shouldn’t be the basis of a macroeconomic thesis, but it certainly adds depth to your understanding of certain segments of the economy, allowing you to perceive potential problem areas or opportunities for growth for a broad number of industries. A big mishap many macroeconomic investors made was trusting the restaurant industry’s sales growth in 2016 and 2017. Its sales growth decline made it appear as though a recession was certain. This is why it’s important to avoid opinions and commentary that claim one indicator has more value or credibility than multiple other indicators that could be suggesting something completely opposite.
The scary truth is that at any point in expansions you can cobble together a realistic argument on why a recession is coming soon. Such investor commentary gets a lot of attention, so it keeps perpetuating a false premise. Just because an indicator worked sometime in the past, does not give it credibility by default today.It’s good to learn about both the negative and positive aspects of any investment thesis, especially if it disagrees with your views, but have an open mind. This means avoiding putting too much trust in any one indicator without looking at the counter arguments. Specifically, restaurant sales growth was the weakest in Q1 2017 as it fell to 1.45%. That growth rate was the lowest since the recession and right afterwards. It was below Q4 2007’s rate of 2.2% which was the beginning of the recession. Restaurants are a great gauge to measure consumer health, but sales growth failed at predicting a recession. Q2 2018 sales growth was 9.27% which is the highest rate since Q1 2012. It has rebounded sharply.
Hotel Industry Weakens
The restaurant situation is a great caveat for the chart below which shows the year over year U.S. hotel RevPAR growth rate could go negative for the first time since March 2008.
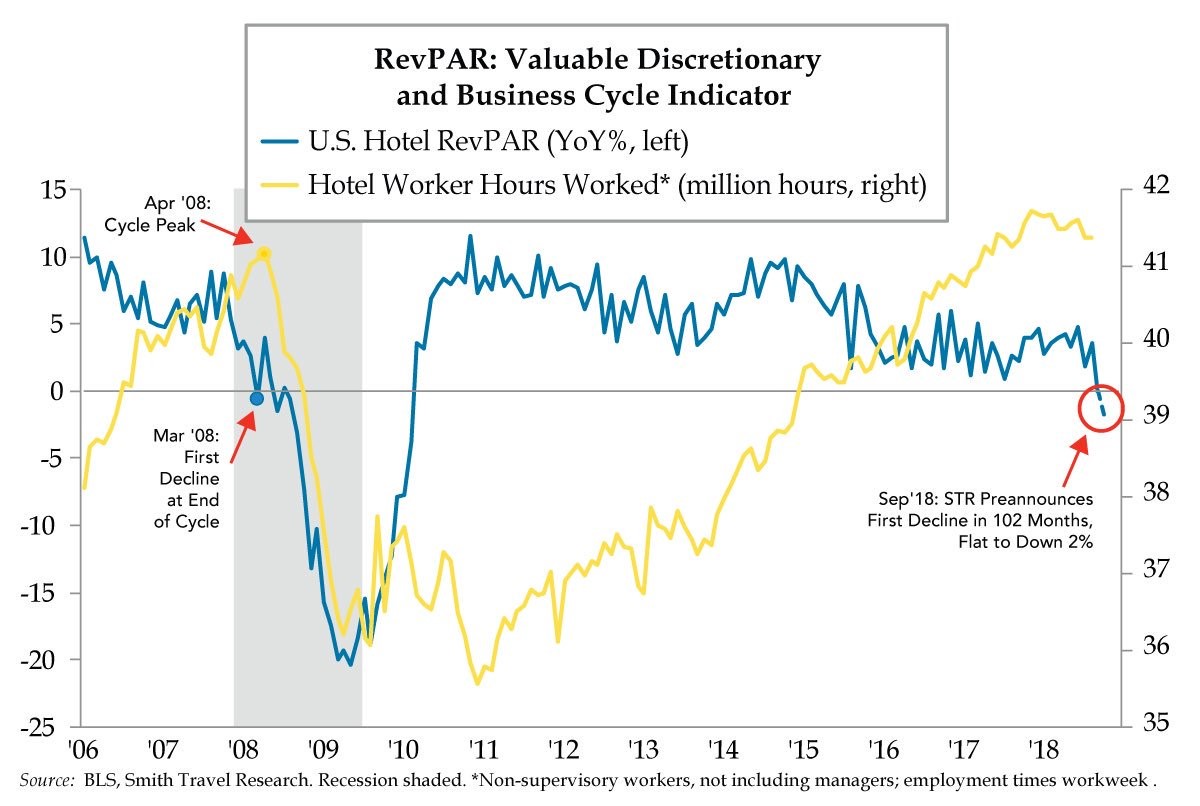
Source: STR & BLS
RevPAR is the product of the hotel’s average daily room rate multiplied by its occupancy rate. It’s the most important ratio in the hotel industry. The hotel workers hours worked total also appears to have hit a plateau. STR, which measures the hotel industry, pre-announced growth of 0% to -2% in September. If this cycle is consistent with the last one, the economy would already be in a recession. However, it could just be a weak month which doesn’t mean anything for the broader economy.
Great August JOLTS Report
The Job Openings and Labor Turnover Survey used to be known as Janet Yellen’s favor labor market report. Now it’s just shared as further evidence that the labor market is extremely strong. This report is delayed one month. To be fair to this report, the BLS monthly non-farms payroll report is revised so heavily it’s almost as if each report is brand new until you wait 2 months to see the final measurement.
This report was spectacular as there were 7.136 million job openings which beat estimates for 6.95 million and the revised July result of 7.077 million. It was also a record high. The chart below shows year over year growth has accelerated to 18.1%.
(Click on image to enlarge)
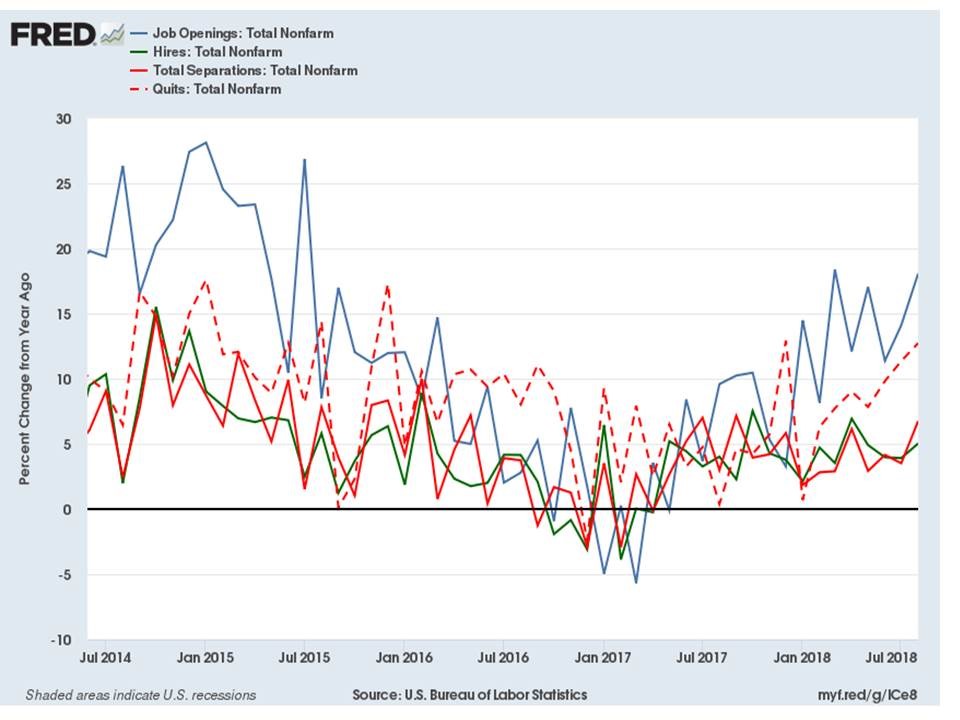
Source: FRED
There was a slight gain in the number of hires from last month as it increased from 5.713 million to 5.784 million. The gap in the number of openings and hires shows the shortage in the labor market caused by the skills gap and employers not being able to afford market rate wages. The quits rate shows how many workers are leaving their job to find better pay and a better work environment with more opportunities. The number of quits fell from 3.608 million to 3.577 million, but the year over year growth rate still improved.
The most analyzed part of the JOLTS report is the relationship between job openings and unemployed people. The Labor Department reported the number of unemployed people actively looking for work fell from 6.234 million in August to 5.964 million in September. The chart below shows there has been more job openings than people looking for work for a few months.
(Click on image to enlarge)
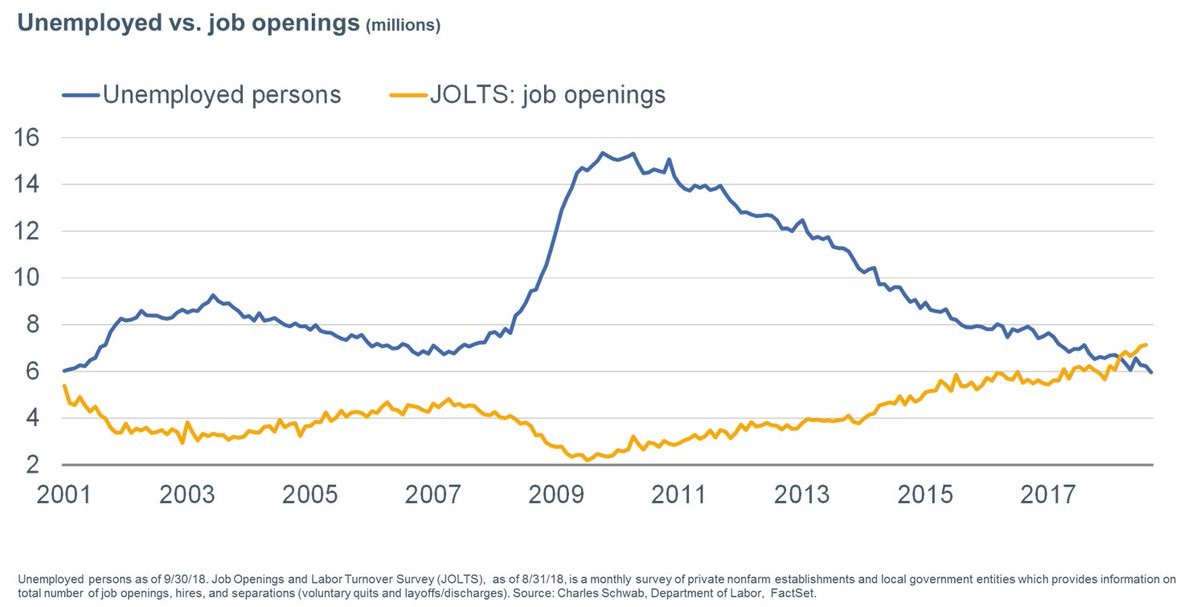
Source: BLS
This is the first period this has happened in this survey. Keep in mind, we consider it bad news that more people left the labor market than got a job. Either a large swath of people retired, people decided they didn’t want a job, or they gave up looking for one.
The charts below show the openings in the construction industry and professional and business services.
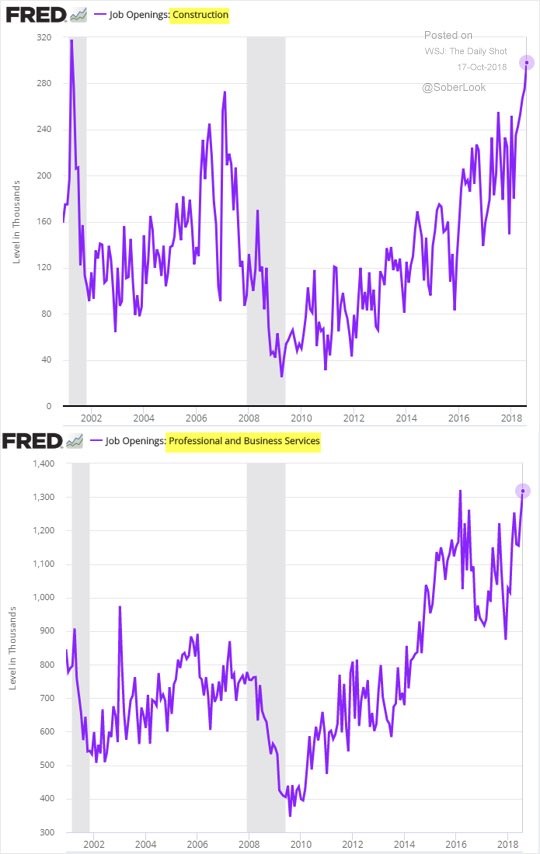
Source: The Daily Shot
The construction industry is facing a labor shortage. That’s another reason the home builder stocks have fallen. They need to pay workers higher wages, it’s tough to find them, metals tariffs have increased prices, and some end markets are weak as buyers find houses unaffordable partially due to rising rates. Professional and business has been one of the leading catalysts for job growth this expansion. It’s good to see openings recovered along with the restaurant sector.
NY Fed Monkey Wrench
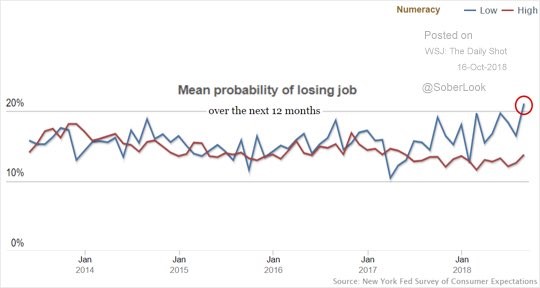
As we mentioned, there is always a negative story even when the economy is strong. The chart below shows the NY Fed’s research on people’s worries about job losses.
Source: NY FED
Low numeracy (mathematical literacy) is less educated people and high numeracy is highly educated people. Weirdly, even though the labor market for those with less education is extremely strong, historically speaking, these workers are the most fearful of losing their jobs in at least 4 years.
Conclusion
The hotel industry is weak, which is a recession signal. This could be wrong like restaurant weakness was in 2016 and 2017. The JOLTS report showed the labor market is extremely strong. Some might say it is overheated and job shortages are a problem. Oddly, those with low numeracy scores are afraid of losing their jobs even though the labor market for those with sparse education is very strong.
Disclaimer: Please familiarize yourself with our full disclaimer here.


