
Gold Market: A Front Row Seat
Late Friday Night Charts
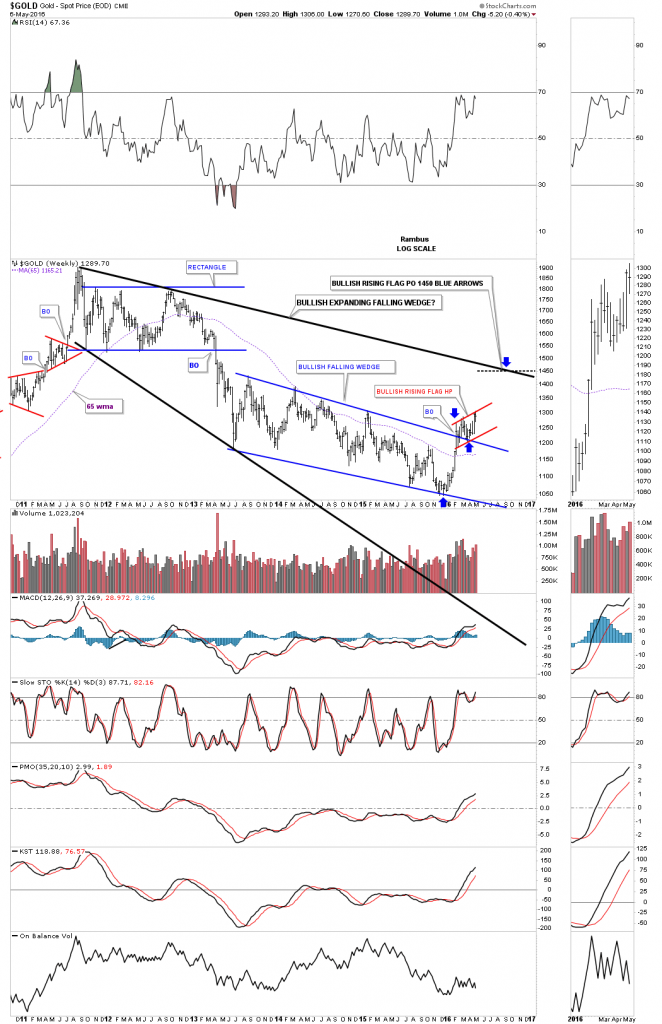
Tonight I would like to show you a six-year weekly bar chart for gold which shows its entire bear market beginning with the top in September of 2011. This bear market is made up of three big individual chart patterns starting with the six point rectangle consolidation pattern. The second pattern is the three year bullish falling wedge and the third big pattern is the black expanding falling wedge.
Technically gold is still in a bear market until it can break out above the top rail of the five year black expanding falling wedge. As you can see the top rail comes into play around the 1450 area which is about 160 points higher from today’s close. As we’ve discussed many times in the past, sometimes a small consolidation pattern will form, just below, right on top or right on that important trendline. Sometimes we’ll even see a consolidation pattern form below and one on top of an important trendline. No matter what we end up calling the little red consolidation pattern that has formed just above the top rail of blue bullish falling wedge, it looks like a consolidation pattern forming at one of the most logical places.
If we measure the little red flag, or whatever consolidation pattern ends up forming, the price objective will be up to the 1450 area. Many times a measured move can be dead on the money but the best way to use a measured move is to see if it corresponds to an important trendline or some other important point on a chart. Here you can see the price objective is up to the top black rail of the expanding falling wedge, so wherever the price action hits the top rail, that should offer initial resistance and a good place to look for a consolidation pattern to start building out.
It will be most interesting to see how gold will interact with top black trendline at 1450 or so. If this is a very strong new bull market for gold we might see a two or three month consolidation pattern form just below 1450. Gold could build out two consolidation patterns, one below the black trendline and one above before the breakout is complete and we can say without hesitation the bear market is over.
You have a front row seat to what is happening in gold right now and what we may expect going forward. As long as this scenario keeps playing out, it is what it is until it isn’t. Have a great weekend. All the best…Rambus
PS:
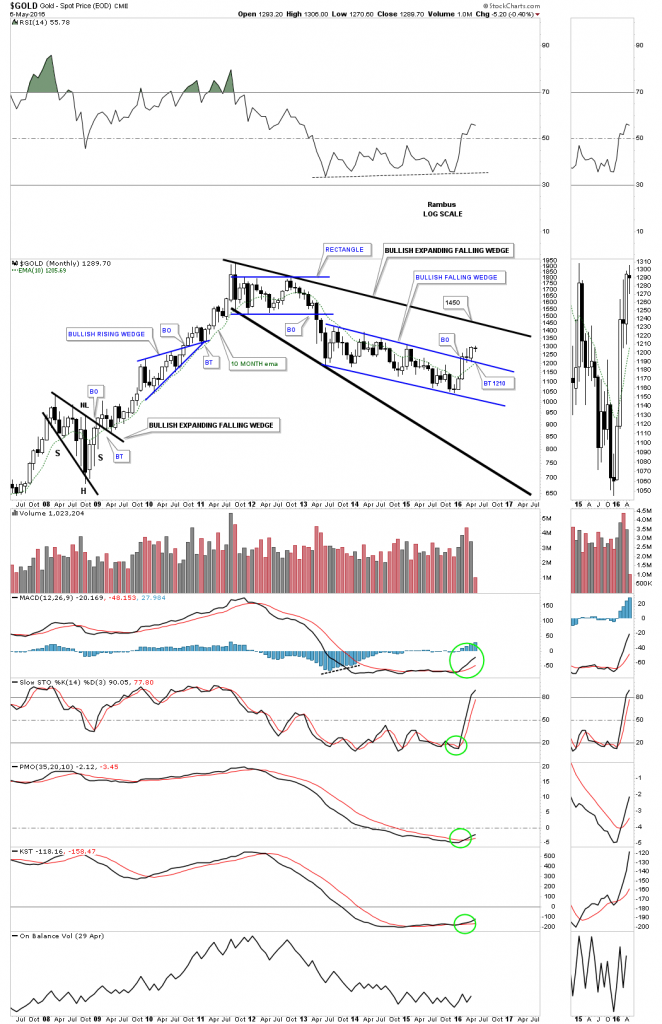
This monthly chart shows how the black expanding falling wedge fits into the bigger picture. The month of May is still young yet but to add another layer of confirmation to the move up to the 1450 area and beyond, it would be very nice to see a big white candlestick form this month.
Disclosure: None.


Thanks again for one of your great articles, Rambus.