GLDX Update
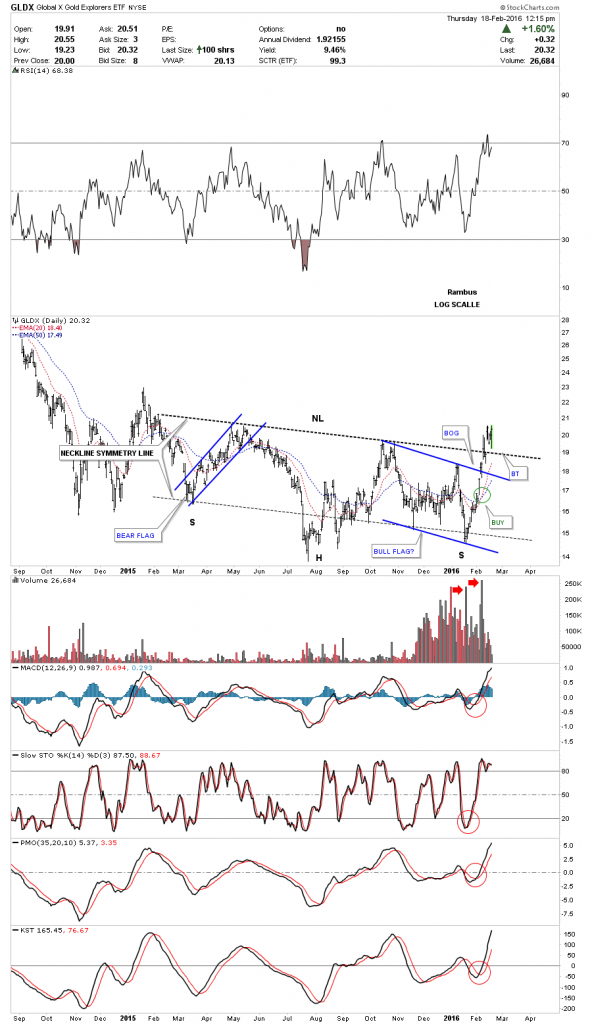
The GLDX is a global gold explorer etf we looked at last week which was showing the interaction with the neckline. With the blue bull flag as the right shoulder it looks like this index has completed the breakout and backtest to the neckline. The inverse H&S bottom also has some nice symmetry as shown by the neckline symmetry line for the bottom of the left and right shoulders. The breakout was on nice volume with the 20 day ema crossing above the 50 day ema also giving a buy signal.
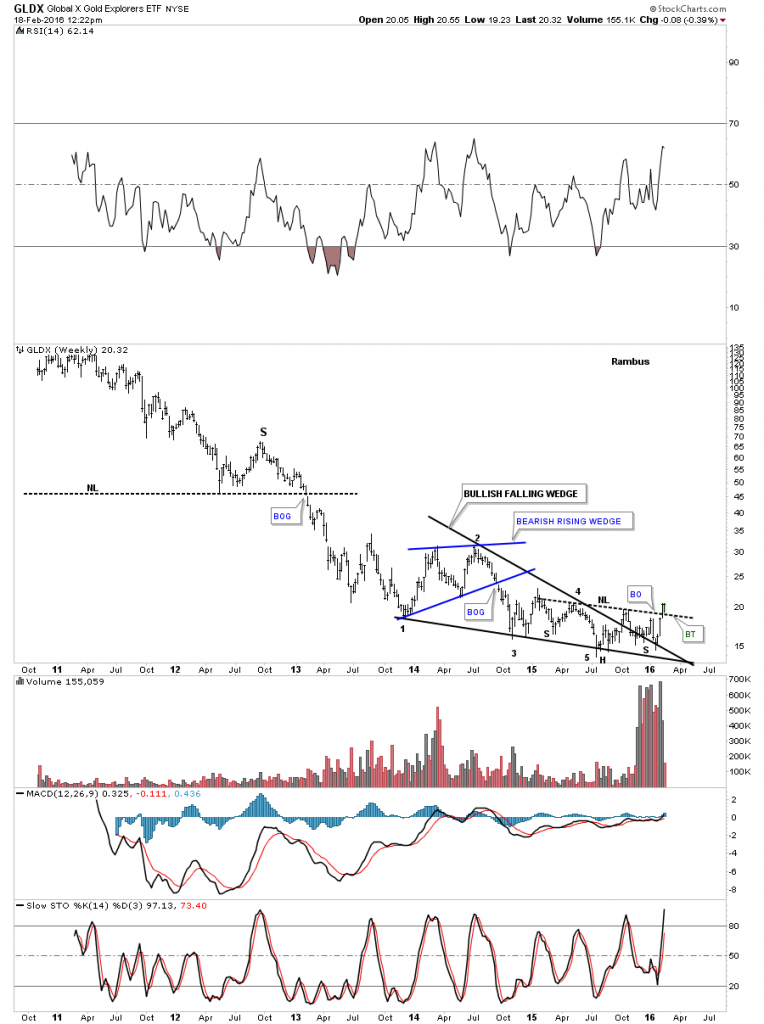
The weekly chart shows another backtest to the neckline this week which has held beautifully so far. This bottoming formation looks like one of the classical reversal patterns from a Chartology perspective. Note how the left shoulder and head formed inside the black falling wedge. The right shoulder was created on the backtest to the top rail. This is basically a two year bottom formation.