
Holding Pattern
The portfolio finished August much in the same fashion as in the previous four months, stumbling to a monthly loss of about 0.7%. The dip extended the decline since May to a total of 1.1%—a far cry from the punchy +6.4% in the first four months of the year—and paltry compared with the MSCI World's +3.7% return in the same period. The numbers get even worse by adding currency effects.
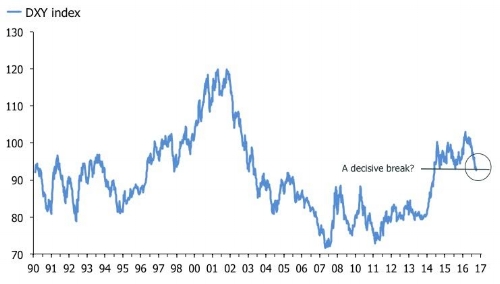
In a nutshell, your humble scribe has found himself on the wrong side of the contrarian trade of the year; the greenback's fall from grace. Accounts denominated in DKK and GBP with a lot of USD denominated investments have not been particularly friendly for returns so far in 2017. Speaking of which, traders' arguments about the dollar is reaching a crescendo and I have a decision to make. A few weeks ago I mused that if DXY broke 93 to the downside, punters would need to rethink their views. The DXY slipped to 92.5 towards the end of August, and I imagine many FX geeks are doing just that. The chart below shows that the dollar hasn't exactly crashed through support, so it still has time to step back from the brink, but it's getting sporty.
EURUSD has been fighting to punch through 1.20, and it has taken all kinds of convoluted trial balloons from ECB "sources" to keep it in check. GBPUSD and AUDUSD are grinding higher, making the classic "higher lows" formations and USDCAD is flirting with a renewed break lower into the abyss after a home run Canadian GDP report. Even the once so mighty USDCNY has completely lost the ghost. I don't punt FX, but I am tempted to fade it. That said, I wonder whether the pain trade isn't in fact for further dollar weakness. Judging by my indirect long-exposure via dollar denominated equities and bonds, that would seem to be the case.
I was pleased to see a number of my single names regain their mojo at the end of August and on the first trading day of September. Many of them have been severely beaten recently, so I am confident that there are a couple of positive surprises coming my way. Unfortunately, for the market as a whole, I am not convinced that the rebound since the middle of August is durable. Trailing six-month and year-over-year returns have rolled over, and a many leading indicators suggest that they will weaken further. Last week, I showed that momentum in global M1 growth signals falling returns in the next six months—even if underlying support from central banks remain firm—and the first chart below shows my updated valuation score for the MSCI World. Six-month returns peaked in May, and the model suggests that weakness will persist. Even worse, the market's resilience in the past few weeks has not been accompanied by improving breadth. A market that rallies on thin legs is a market that warrants skepticism.


In the bond market, the U.S. curve remains flat and I regret to inform you that I am a bit lost with respect to what happens next. I have been talking about a do-or-die moment for the bond market this year, and presented you with a choice of four scenarios.
"1) The parallel flattener - In this scenario, the Fed raises rates about five times in the next 18 months, and two-year yields go north of 2%. The curve flattens, but also performs a parallel shift higher. Crucially, in this scenario 5-year and 10-year yields increase—substantially—but less so than the 2-year yield, which will soar as the Fed pushes ahead. In this scenario, the curve does not invert in the next 18 months, but it will be very flat at the end of it.
2) The Trump steepener - In this scenario the Fed also raises rates five times toward the end of 2018, but the economy improves faster than the Fed can keep up with. Presumably, this could only happen if we observed a serious "ketchup effect" in terms of inflation and nominal growth and/or if the White House suddenly delivered on both infrastructure and a bullish—but not protectionist—tax reform. Needless to say that this scenario would be cold steel for bondholders across the curve, but especially for duration bulls.
3) The u-turn - In this scenario the Fed is spooked by the dramatic flattening of the yield curve in response to even a modest hiking cycle. As a result, the FOMC backtracks and shuts down the hiking cycle. Given the silliness being practiced at the BOJ and the ECB, I reckon they could just about get away with this by blaming their foreign colleagues, but let's face it; it wouldn't be a good look for Yellen and company. If this forecast is true, I have to assume that Spoos and Blues will fly high. EDs will soar, and stocks will continue to grind higher on the promise of extended low rates. 5-year and 10-year yields should push higher, and the curve should steepen.
4) The great inversion - In this scenario the Fed pushes ahead, but bond markets won't have it and the curve continues to flatten. It is important to understand here how quick the curve would invert if this is the case. Think about 5-year and 10-year yields, which are now at about 1.7% and 2.1% respectively. If the Fed moves further and the current trend persists, we're looking at an inversion as soon as Q1 next year. The main victim here has to be the stock market. From the perspective of the Fed, this scenario would signal a bold Fed, which is willing to suffer the slings and arrows of an inverted yield curve in order to achieve a good distance between itself and the zero bound."
I have been leaning towards the idea that if the Fed keeps pushing, the curve would flatten further. But I been on the fence with respect to whether markets were looking at a quick inversion or a parallel flattener. I am skeptical that the intention to shrink the balance sheet—in effect allowing bonds to run off without reinvesting the principal in new bonds—necessarily would lead to higher long-term yields. What ultimately matters I think is the pace with which the Fed nudges the FF rate higher. I have identified the 2s5s as the key indicator here based on the idea that the Fed hiking cycle would be shorter, and hit a lower terminal rate, than in the past. The first chart shows that 2s5s remains flat, poised to break below 30bp, while the second chart indicates that a further upturn in U.S. macroeconomic surprise indices probably would lead to a slightly steeper curve, and perhaps also even a stronger dollar.


Here is the problem, however. Hurricane Harvey is going to screw up everything. The economic data will be virtually uninterpretable in the next three-to-six months. Unemployment claims will go ballistic; Texas is a bigger and more important region for the U.S. economy than Louisiana was in 2005 when Sandy tore that state apart; a jump in unemployment claims to above 700k is not out of the question.
Industrial production will be hit by a loss of refining, which will show up in falling energy output. I can't say with confidence whether this will have repercussions further back in the chain to actual holes in the ground, but it's possible. Finally, construction and building permits will be stung in the short run as work is curtailed; investment in this sector also could well be revised down in Q4—and indeed in subsequent quarters—as the extent of destruction to existing projects are fully appreciated. Retail sales also will take a hit as households in Texas are taken out of the macroeconomic equation, at least for a while. Finally, short-term inflation numbers will soar as gasoline prices, used car and food prices jump. Estimates of the total costs vary, which adds to the uncertainty of the short-term chaos in the economic data. I have seen numbers range from $50B to $500B. No matter what the final toll is, markets likely will have to contend with a story soon that this is much bigger than initially feared. In particular, the notion that insurance won't cover all the damage—and that the Federal government won't be able to compensate fully for the residual—will alert markets and policy makers to the fact that the wealth destruction is significant.
In this environment, it is not inconceivable that the Fed will kick back from the table, especially if they go ahead with balance sheet reduction in September. Long two-year notes and FF futures might not be such a bad idea in the final stretch of 2017. Ironically, if Fed rate hikes are kicked into the long grass this could steepen the curve. It would be front-end shorts squeezed out of their positions, though, rather than a dislocation in long-term rates. At some point, probably in the first quarter of 2018 or at the end of Q4 2017, U.S. economic activity indicators will come roaring back as rebuilding efforts begin. Texas is a critical economic engine for the U.S. economy, and Harvey means that prospective yields for capital there have soared, although the region likely will need foreign labor for rebuilding to get going. This will re-engage the Fed, but this story will be hard to eye in the short run as Texas gets to grips with the destruction. This is particularly the case if we add the increased risk of an accident in North Korea or its closest neighbors. It seems a good bet then to assume that when it comes to the economic data and near-term outlook, policy makers and markets are set to enter a holding pattern in the next few months.
Disclosure: None

Comments
 No Thumbs up yet!

