
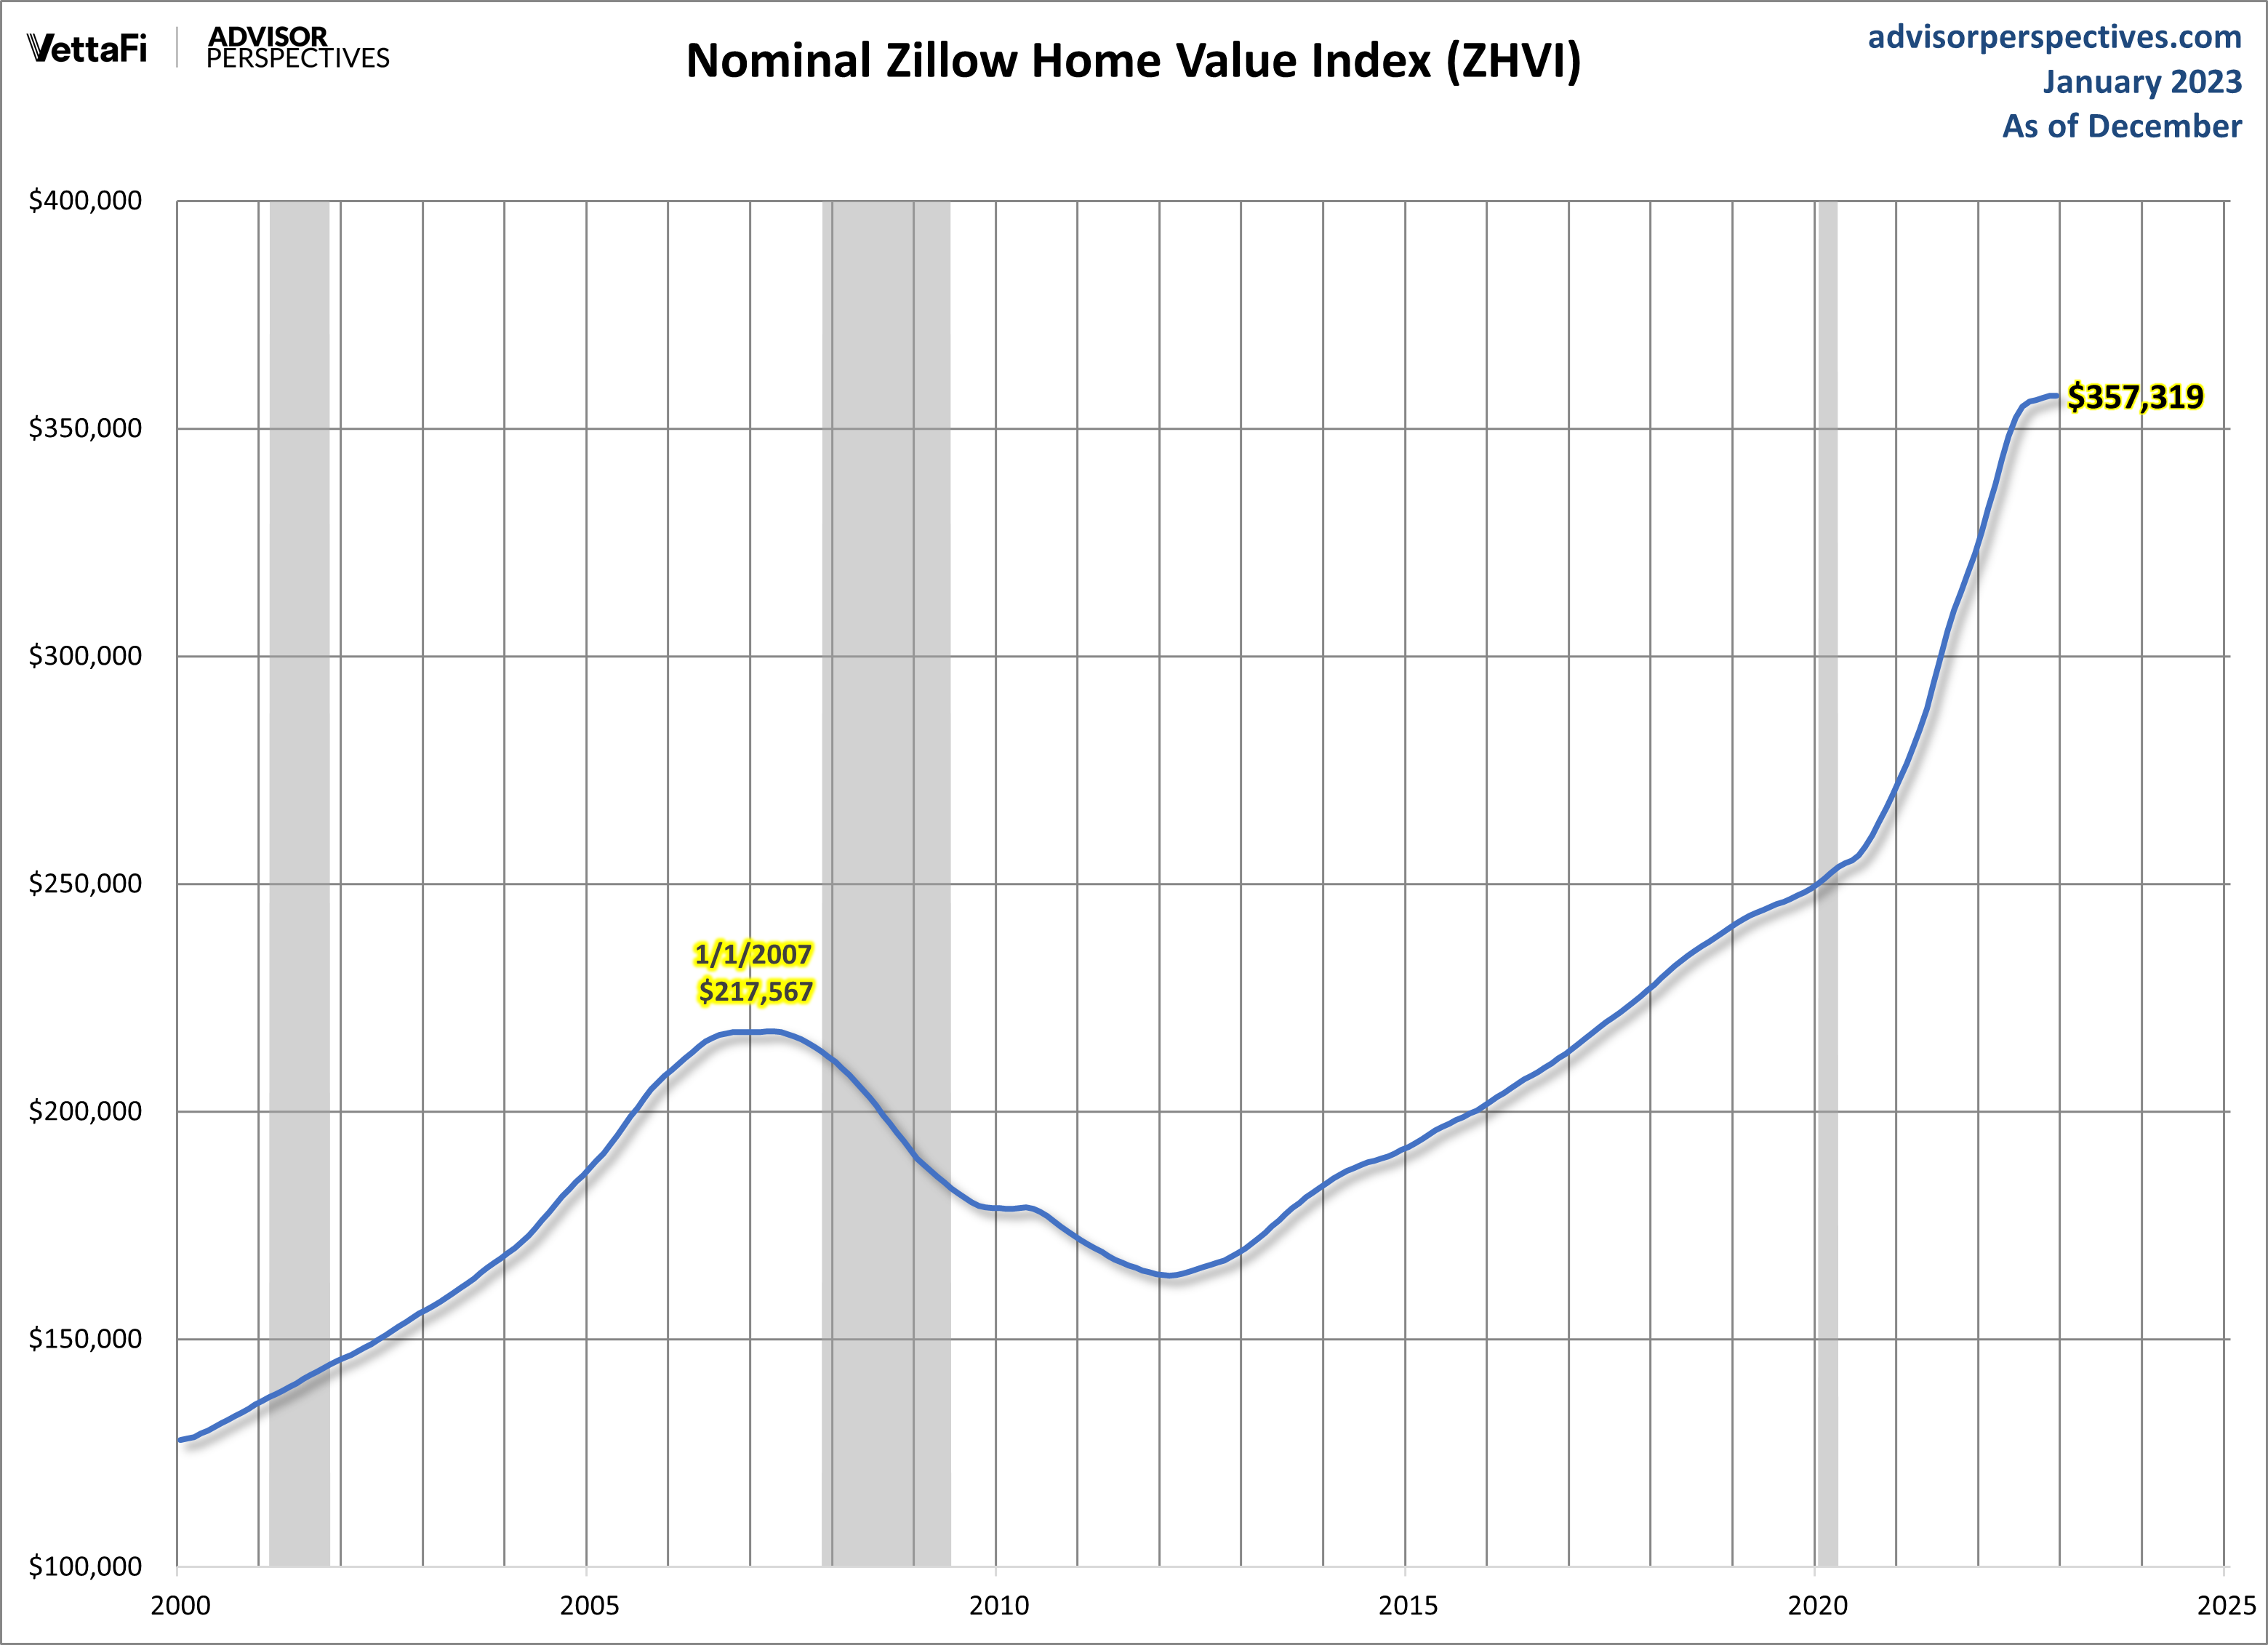
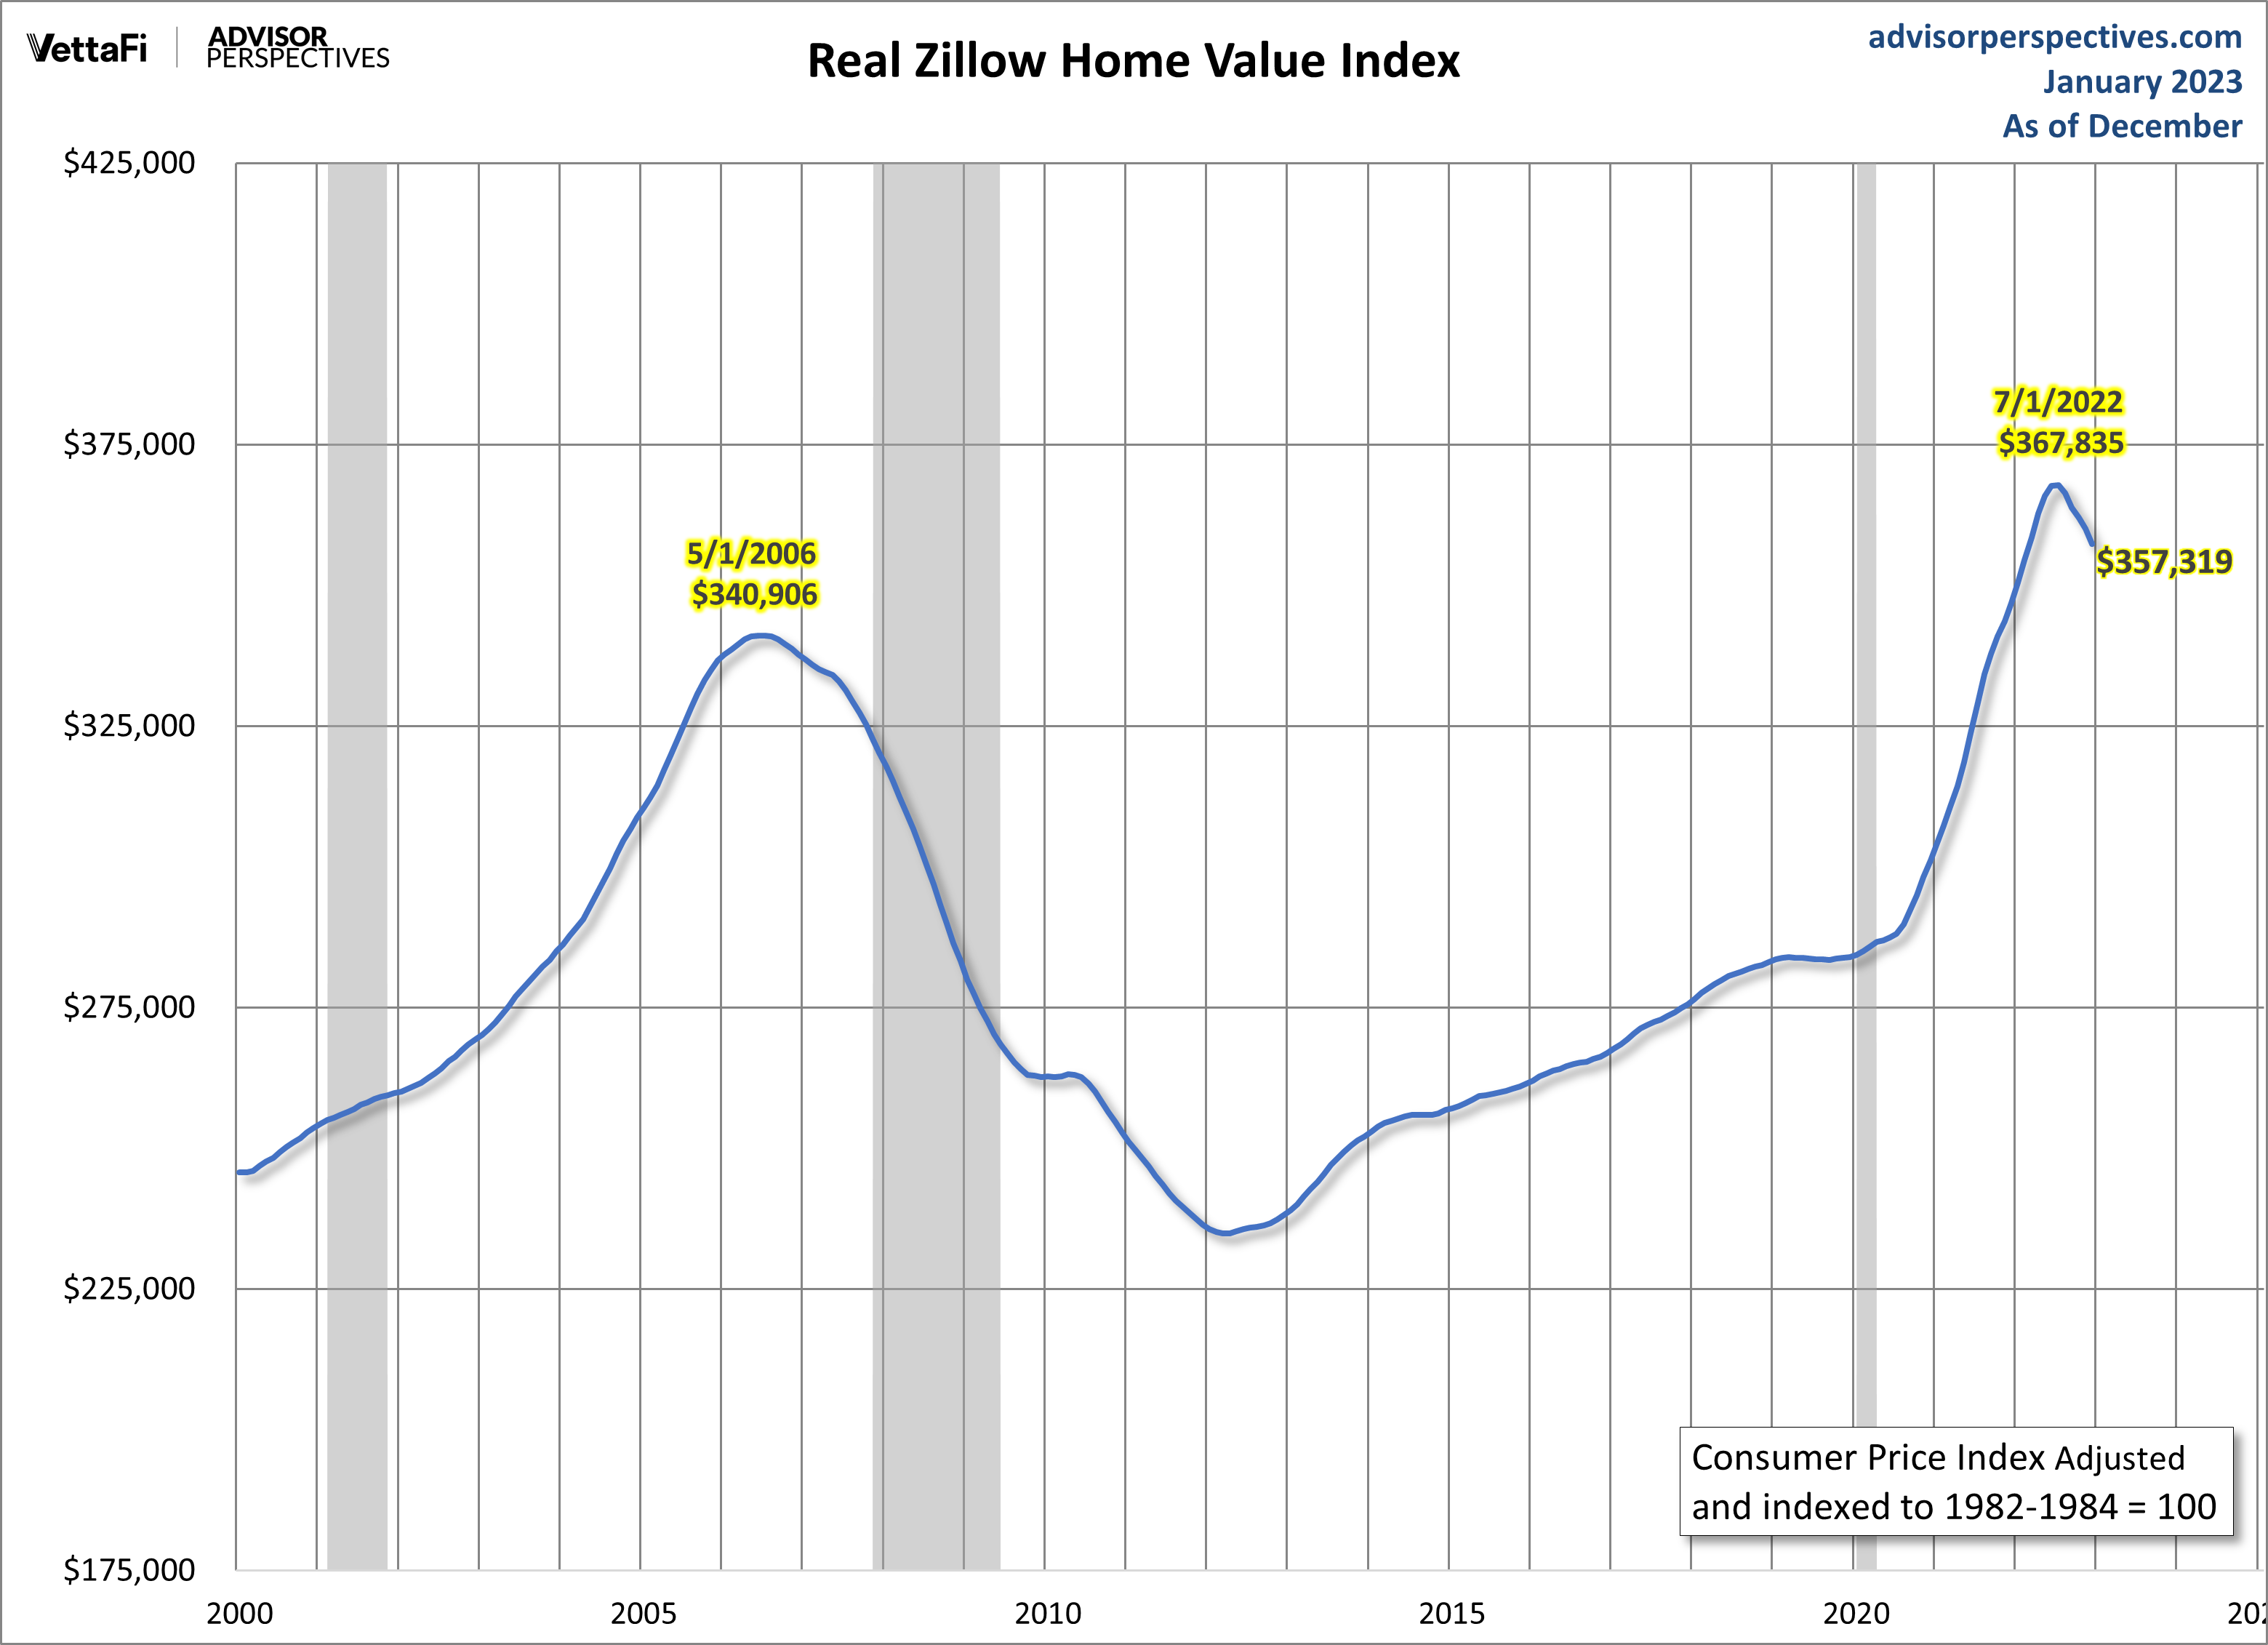
December's ZHVI came in at $357,319, slightly up from the previous month by 0.01% and up 10.8% YoY. After adjusting for inflation, the real figures are -0.77% MoM and 3.02% YoY.
Zillow.com, the real estate listing and brokerage website, makes a wealth of real estate data publicly available. Of these, the Zillow Home Value Index (ZHVI) attempts to provide a seasonally adjusted measure of home values as well as market changes. Specifically, its “flagship” ZHVI uses data for “all homes, middle tier, smoothed and seasonally adjusted cut”. It is supposed to represent the middle of the market for all homes - the “typical home value” - and not the median home value. The index debuted in 2006.
Within the ZHVI, there are a number of “cuts” to look at - for instance by geographical region or housing type. Here, we will focus on the flagship ZHVI, the typical home values.
Methodology
Zillow’s ZHVI is measured using monthly changes in its “Zestimates”, its proprietary home valuation model. The index is meant to be timely, comprehensive, and transparent, published three weeks after the close of a given month. Many other home value indexes are published with a significant time lag - like the S&P at Core Logic Case Shiller Index and the FHFA House Price Index.
ZHVI is calculated with a few assumptions:
- Monthly changes are calculated with a weighted mean
- The average Zestimate within a range determines the index level
- It can be interpreted as the market’s total appreciation for a given geography or cut
In addition, historical appreciation is based on actual historical housing stock versus a fixed basket of homes, and home improvements are considered in appreciation unrelated to market movements.
Index charts
The first chart below shows the flagship ZHVI series - the “typical home value” since 2000. These are nominal values, not adjusted for inflation.
(Click on image to enlarge)
Next, we take a look at the same index values but adjust for inflation using the CPI. As you can see, it’s a different picture. According to the ZHVI, today’s home values are still above that of the (inflation-adjusted) housing peak in 2006, despite peaking in July 2022.
(Click on image to enlarge)
Here are both nominal and real indexes for a comparative look.
(Click on image to enlarge)

Comparison to S&P Case-Shiller index
Zillow claims that the ZHVI are “the most accurate and timely measures of residential real estate prices in the United States" and that its index is more representative of housing stock than the Case-Shiller Index. Zillow claims this due to its extensive database that includes input from real homeowners as well as their sophisticated home valuation model in the Zestimate.
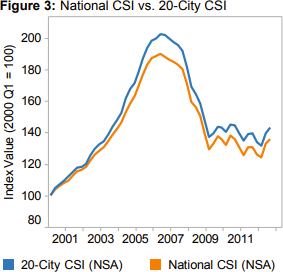
Zillow believes its ZHVI has distinct advantages over the Case-Shiller index. The Case-Shiller (CS) Index uses the repeat-sales methodology, meaning it measures price changes by looking at homes that have resold in a region, while the ZHVI only includes homes that have sold at least twice in recent history and excludes all new construction. Here are a few charts pulled directly from a piece by Zillow comparing the two indexes. We tried to get this data to do our own analysis, but the research group there would not provide it. Here’s a link to that article.
(Click on image to enlarge)
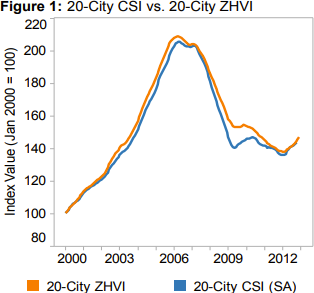
(Click on image to enlarge)
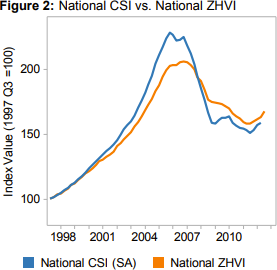
(Click on image to enlarge)
© Zillow.com
Another difference between the CS and ZHVI is that CS includes foreclosure resales. Zillow emphasizes that foreclosure resales are “substantially different from non-distressed sales” and are often considerably discounted from such. Zillow claims that using foreclosure resales represents “two very different market segments”. Eric Stubbs, Ph.D. at RBC WM believes foreclosure sales is a matter of taste and says that foreclosures are actual sales, so they do in fact affect the price of surrounding properties.
In any case, the ZHVI is another tool in the tool belt to determine home values and is useful due to its timeliness and variety of information.
More By This Author:
Weekly Unemployment Claims: Down 15K, Better Than ForecastCryptocurrencies Through Wednesday, Jan. 18
NAHB Housing Market Index: "Builder Confidence Uptick Signals Turning Point for Housing Lies Ahead"


Comments
Log in or sign up to join the conversation.