
XRP Price Is Consolidating Within This Pattern — What’s Next?

Image by WorldSpectrum from Pixabay
The XRP price performance has been one of the bright spots in the cryptocurrency market over the past seven days. With the crypto climate becoming more uncertain with each passing day, the XRP token has been the only large-cap asset exhibiting some level of relative stability.
While the altcoin has been moving mostly sideways in recent weeks, the current speculation is that the price of XRP could be on its way to a bullish breakout. The question is — how far can the third-largest cryptocurrency in its next leg up?
Can XRP Reclaim $3 In Next Move?
In a March 7 post on the social media platform X, popular crypto trader Ali Martinez put forward an interesting prognosis for the value of XRP over the next few days. Martinez revealed that the altcoin’s price appears to be ready for a significant 23% breakout to the upside.
The reasoning behind this bullish prediction is the appearance of a symmetrical triangle pattern on a short-term timeframe of the XRP chart. The symmetrical triangle is a technical analysis pattern characterized by a diagonal falling upper trendline (connecting the swing highs) and a diagonally rising lower trendline (along the price troughs).
Typically, symmetrical triangle formations are considered trend continuation patterns, implying that the asset’s price tends to continue in its initial trend direction before falling into the triangle pattern. While in the triangle pattern, the price moves — in a tapering fashion — towards the symmetrical triangle’s apex.
The price would eventually breach the falling (upper) trendline for a bullish breakout or break below the rising (lower) trendline forming a breakdown. While a trend reversal (I.e. the asset’s price breaks opposite its initial trend direction) is possible, the price is more likely to continue in the original trend direction after breaking out or down the current layout.
(Click on image to enlarge)
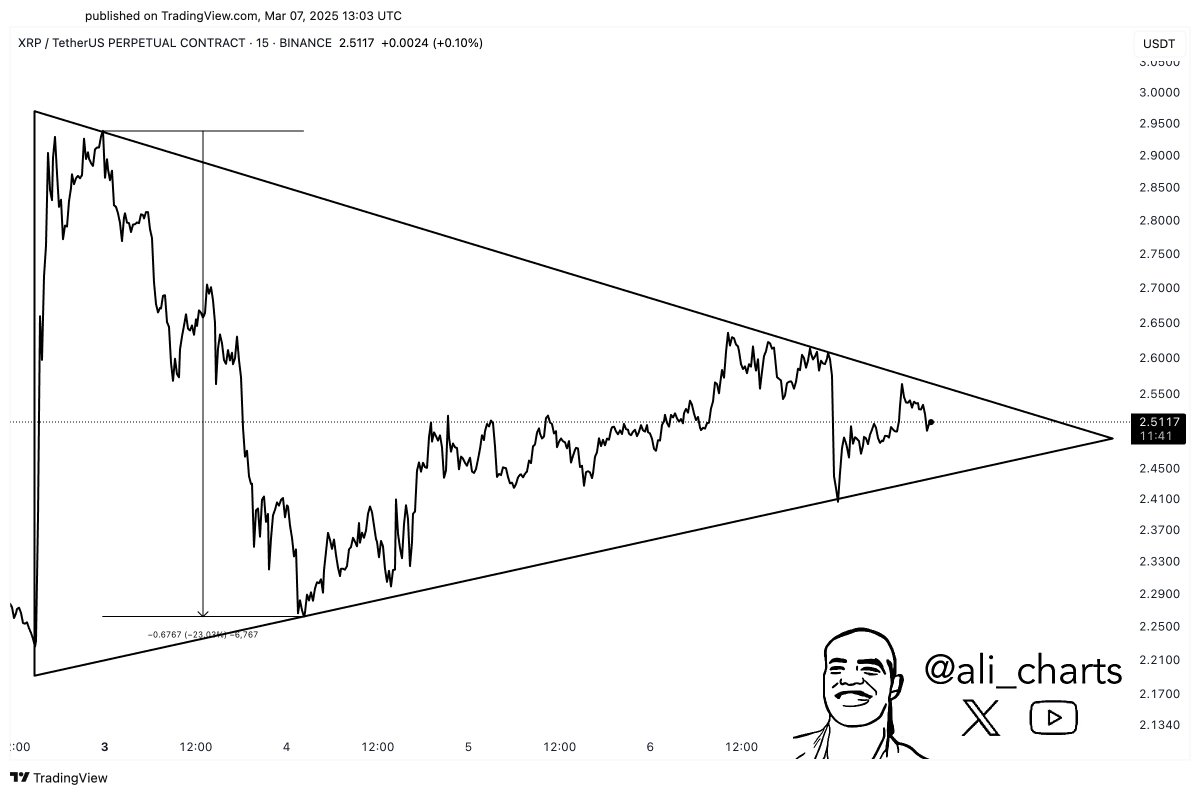
In the current XRP price setup, the altcoin looks likely to break out of the symmetrical triangle and continue its upward trend. However, it is important to wait for the close of at least two candlesticks above the upper trendline to confirm a bullish breakout.
Going by this logic, Martinez expects the price of XRP to surge to above $3 (about 23% growth from the current point) over the coming days. This price target was calculated by adding the length of the widest point of the symmetrical triangle (or base) to the breakout point.
XRP Price At A Glance
As of this writing, the XRP token is valued at $2.47, reflecting an over 5% price decline in the past 24 hours. Nevertheless, the altcoin’s performance on the weekly timeframe remains strong — at about 15% in the past seven days.
(Click on image to enlarge)
More By This Author:
Bitcoin Price Crash Incoming? Why A Fall To $63,000 Is Possible If This Resistance Holds
Bitcoin Bullish Signal: $900 Million In BTC Leaves Exchanges
Bitcoin Enters ‘Optimism Stage’ - Is A Massive Rally About To Begin?
Disclaimer: The information provided by Block Adventure SRL or Crypto Adventure (“we,” “us,” or “our”) on more


