
Will Japan's $2.1 Trillion Stimulus Send The Nikkei 20% Higher?
Prime Minister Shinzo Abe has doubled down on helping Japan combat the economic effects of the coronavirus by delivering the world's biggest stimulus package. On Wednesday 27 May, Abe's cabinet approved 117 trillion yen (roughly 1 trillion USD) worth of additional measures to keep businesses and households afloat. This brings the total to 234 trillion yen (roughly 2.1 trillion USD).
Japan's main stock market, the Nikkei 225 index, was already trading higher before the news and on the day of the announcement was up more than 35% from the current 2020 low made in March. With the price only 20% away from the all-time high (from the start of the week the announcement was made) can it get there? We discuss the situation, so read on!

A 234 trillion yen Covid-19 solution?
The coronavirus has wreaked havoc on global markets and economies. Official data from Japan shows that it has sunk into a deep recession with support for Prime Minister Abe's cabinet falling to fresh lows. To win back support and help the country out of the recession, Abe announced one of the world's biggest stimulus packages.
The 117 trillion yen (1 trillion USD) worth of measures agreed on Wednesday 27 May include providing finance for struggling companies, helping companies to pay their rent in the form of subsidies and providing support for health care. This comes on top of the stimulus package announced only last month, bringing the total to amount to 234 trillion yen. A number which is around 40% of Japan's gross domestic product (GDP).
The Bank of Japan has also pledged its support to make sure bond yields do not rise. However, some analysts are concerned that the new spending will take Japan's debt ratio to a record level of 56.3%. This makes Japan holders of the biggest level of public debt of any developed country in the world. In fact, it's more than twice the size of its economy.
These measures come into place even though Japan has lifted its nationwide state of emergency. The number of new virus cases has also fallen. Nevertheless, analysts are still seeing a slow recovery in exports and tourism which are key areas of Japan's national income. Regardless, the government has announced they are prepared to do anything to get the economy growing again, helping the Japanese stock market to push higher.
How to trade the Nikkei 225 index
With Admiral Markets UK Ltd you can speculate on the price direction of Japan's largest stock market, the Nikkei 225, using Contracts for Difference (CFDs). This product allows you to go long and short a market, using leverage. You can learn more about the advantages and risks in the 'What is CFD Trading?' article.
Did you know that you can also trade CFDs and invest into 195 Japanese stocks with Admiral markets? You can learn more in the 'How to Trade the Japanese Stock Market' article.
Below is the long-term, monthly price chart of Japan's Nikkei 225 stock market index:
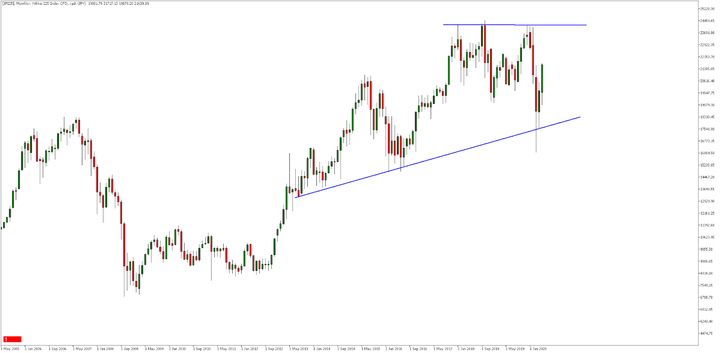
Source: Admiral Markets MetaTrader 5, JP225, Monthly - Data range: from 1 May 2005 to 27 May 2020, accessed on 27 May 2020 at 10:30 pm BST. Please note: Past performance is not a reliable indicator of future results.
In the chart above, the two blue support and resistance lines have formed a chart pattern known as an ascending triangle. It is a bullish chart pattern where traders would typically buy at the lower ascending support line in anticipation of the market moving back to the top horizontal resistance line.
Many global stock markets bounced off their respective lows made during the coronavirus-led sell-off at the beginning of the year due to stimulus actions from central banks all around the world. However, the Nikkei 225's rally higher has been particularly strong and was up more than 35% from its March lows, on the day the second round of stimulus measures were announced.
While traders anticipated stimulus measures from Japan's government, the magnitude shocked many analysts. This has helped fuel a further push to the upside with traders now eyeing the all-time high price level of 24,175. This would represent a near 20% push higher from the beginning of the week the second stimulus announcement was made.
The daily price chart below also shows a bullish picture with a series of higher high and higher low cycle formations, signalling that someone is buying the dips. Price is also trading above its 20-day exponential moving average. If it can stay above this many traders may remain with their long positions towards its all-time high price level.
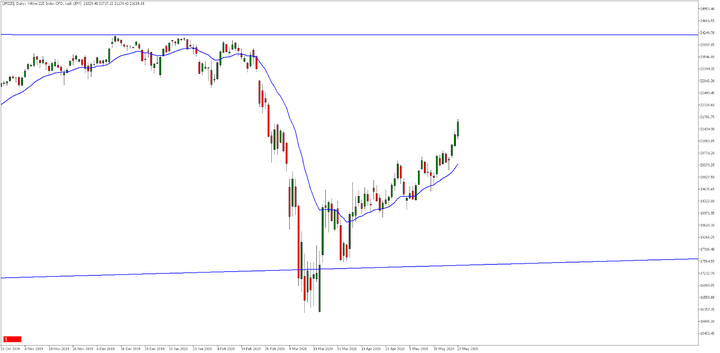
Source: Admiral Markets MetaTrader 5, JP225, Daily - Data range: from 23 October 2019 to 27 May 2020, accessed on 27 May 2020 at 10:45 pm BST. Please note: Past performance is not a reliable indicator of future results.
While the fundamental and technical picture remains bullish there are - as always - some external risk events that could play a part. Rising US-China tensions regarding the situation in Hong Kong could easily escalate, derailing any impact from government stimulus - at least in the short-term.
Disclaimer: The given data provides additional information regarding all analysis, estimates, prognosis, forecasts or other similar assessments or information (hereinafter "Analysis") ...
more

