
Why Ethereum Classic Plummeting On Wednesday Is A Healthy Move, And How To Trade This Pattern

Photo by Nick Chong on Unsplash
Ethereum Classic was plummeting about 15% lower on Wednesday after soaring about 116% higher between March 14 and Tuesday. The fall shouldn’t concern bullish traders because Ethereum Classic has developed an inside bar pattern on the daily chart. An inside bar pattern indicates a period of consolidation and is usually followed by a continuation move in the direction of the current trend.
An inside bar pattern has more validity on larger time frames (four-hour chart or larger). The pattern has a minimum of two candlesticks and consists of a mother bar (the first candlestick in the pattern) followed by one or more subsequent candles. The subsequent candle(s) must be completely inside the range of the mother bar, and each is called an "inside bar."
A double, or triple inside bar can be more powerful than a single inside bar. After the break of an inside bar pattern, traders want to watch for high volume for confirmation the pattern was recognized.
- Bullish traders will want to search for inside bar patterns on stocks that are in an uptrend. Some traders may take a position during the inside bar prior to the break, while other aggressive traders will take a position after the break of the pattern.
- For bearish traders, finding an inside bar pattern on a stock that's in a downtrend will be key. Like bullish traders, bears have two options of where to take a position to play the break of the pattern. For bearish traders, the pattern is invalidated if the stock rises above the highest range of the mother candle.
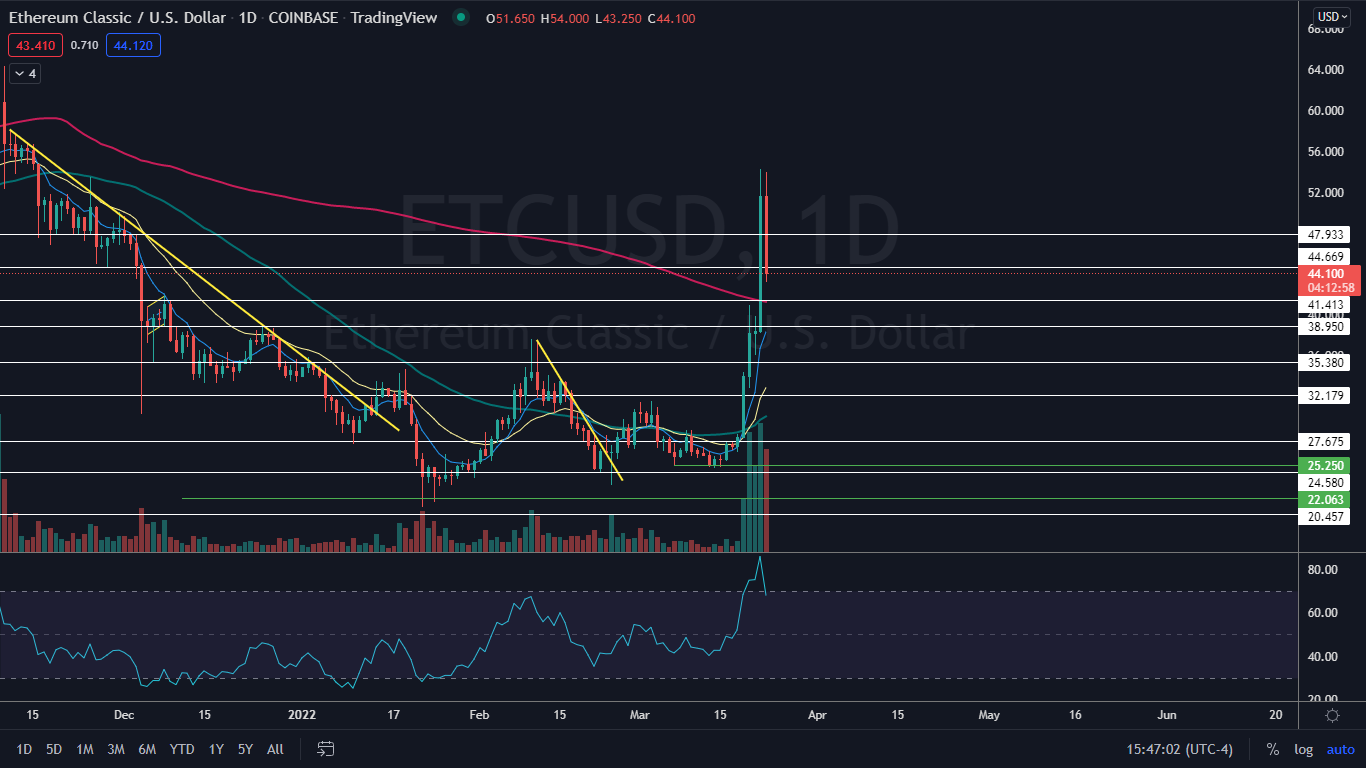
The Ethereum Classic Chart: Ethereum Classic’s massive reversal to the upside was in need of eventual consolidation to confirm an uptrend, which Benzinga called out was likely to happen on Tuesday. The retracement on Wednesday is completely within the range of Tuesday’s mother bar, which leans bullish because the crypto was trading higher before creating the pattern.
- Although the pattern leans bullish, traders can watch for a break up or down from the inside bar pattern on Thursday to gauge future direction.
- The retracement has also caused Ethereum Classic to print a higher low to confirm the uptrend and will allow the eight-day and 21-day EMAs to catch up more closely to the crypto’s price, which will support the crypto if it continues trending upwards.
- The 200-day simple moving average that Ethereum regained as support on Tuesday will also act as support on the retracement.
- Due to the current extreme volatility, it is possible Ethereum Classic will print a second inside bar on Thursday and not choose direction until Friday. It is also possible the crypto continues to trend lower over the coming days and settles into a bull flag pattern on the daily chart.
- Ethereum Classic has resistance above at $44.66 and $47.93 and support below at $41.41 and $38.95.
(Click on image to enlarge)
© 2022 Benzinga.com. Benzinga does not provide investment advice. All rights reserved.


