
Which Retirement Income Strategy Is Best To Pursue? Here's An Analysis Of 3
Given the myriad of products available to today’s retirees, there are a lot of choices to consider about which retirement income strategy to pursue [but] ...which...is the best – is remarkably difficult to determine...[as] “best” depends heavily on how you measure what “best” means. Careful thought about how a strategy will be evaluated is an essential aspect of the process in crafting an approach to financial planning. This article analyzes three such approaches based on wealth, spending, probabilities of success, magnitudes of failure and utility functions that weigh both the upside and downside risks.
Written by: Michael Kitces (AdvisorPerspective.com)
For instance, the retirement strategy that produces the greatest wealth is generally to just not spend very much! If the goal is to maximize spending, then the best strategy is to invest as aggressively as possible. Yet portfolios with maximal growth also produce the greatest catastrophes, which means a risk-averse retiree may not want that approach.
Thus, in framing different retirement income strategies – and the trade-offs they entail – it’s important to scrutinize the measuring stick used to evaluate the outcomes. The best retirement income strategy will depend on whether you measure based on wealth, spending, probabilities of success, magnitudes of failure or utility functions that weigh both the upside and downside risks!
Determining how to measure the best retirement income strategy
Assume a 65-year-old couple is trying to decide how much to spend for a 30-year retirement from their $1,000,000 portfolio and how that portfolio should be invested. The choices might include:
A) Spend an inflation-adjusting $30,000/year from the portfolio, by putting 90% of it into an immediate annuity and keeping the other 10% in cash reserves
B) Spend an inflation-adjusting $45,000/year from the portfolio, and invest it 50/50 in stocks and bonds
C) Spend an inflation-adjusting $60,000/year from the portfolio, and invest it 100% in stocks
Accurately assessing which strategy is best depends heavily on how the outcome is measured.
Measuring retirement outcomes by projected wealth
The first way the [above] three strategies might be assessed – and the most common methodology for the first several decades of financial planning – is to project how wealth would accumulate and compound over the 30-year retirement time horizon.
The chart below graphs the remaining wealth in the portfolio across each of the three strategies, assuming inflation averages 3%, and that long-term 30-year investment returns are 3% for cash, 5% for (intermediate) bonds, and 10% for stocks. (The immediate annuity is assumed to have a principal refund feature if death occurs before the payments have been recovered, which winds down over time as the payments are made.)

Strategy C, spending $60,000/yr and investing 100% in stocks, is the best. Ironically, this is true even though in many cases, long-term wealth is maximized by spending less (and allowing the portfolio to grow), as in strategy A. The growth rate of stocks, however, is so dominant that strategy C creates the most long-term wealth, even though its growth is slowed by the largest ongoing withdrawals.
Measuring retirement outcomes based on cumulative spending
Strategy C created the most wealth – despite taking the largest withdrawals, but retirees should not measure outcomes based on final wealth alone. Otherwise, for any two strategies that have similar returns, the better one will always be the one with the least spending. At the extreme, the most successful strategy would be to never spend a dime of one’s retirement funds.
An alternative approach is to look at the cumulative amount of dollars spent, which more accurately represents the retiree’s opportunity to enjoy his or her wealth. In this context, the best strategy is not the one with the most money in the portfolio at the end, but the one that allows the most money to be consumed.
On this basis, strategy C is the best. As shown below, strategy C produces by far the largest amount of cumulative retirement income spending, in addition to producing the greatest wealth accumulation over time (as shown earlier), thanks again to the long-term return of equities.

Of course, the caveat to this methodology is that it only shows the projected levels of wealth and spending if average returns are earned. Moreover, it ignores volatility, which matters because when the best strategy is evaluated not based on linear projections but a different measuring stick – the optimal approach changes again.
Measuring retirement outcomes based on probability of success
It’s no longer necessary to project the financial outcome of a strategy based on average returns. Instead, we can measure economic outcomes by modeling thousands of possible scenarios, each with randomized returns and quantify how often the results are successful (i.e., have money left at the end). This approach is known as Monte Carlo retirement analysis. When using this methodology to quantify retirement outcomes, the relative benefits of each strategy look very different.
The chart below shows the Monte Carlo outcomes of our three retirement strategies, including the range of possible outcomes based on a 95% confidence interval (long-term returns that are plus-or-minus two standard deviations).

Now when we observe the range of results:
- strategy C has the best average but also the worst failures (including financial ruin as early as the 22nd year of retirement),
- strategy A has an extremely narrow range of outcomes that are mostly well below the average of Strategy A… but none of them are failures!
In other words, based upon probabilities of success, annuity-based strategy A is now the best – a 100% probability of success, with no projected failures (ignoring the credit risk of the annuity provider) – and strategy C is the worst. The hierarchy of retirement strategies that are best changes completely when using a different measuring stick.
Measuring retirement outcomes based on magnitudes of failure and adjustment
A more nuanced look reveals that just choosing the plan with the highest probability of success (and lowest probability of failure) may not be the ideal approach, either.
After all, the probabilistic superiority of strategy A (the $30,000/year annuity approach) over strategy B (spending $45,000/year from a diversified portfolio) was not by a large margin. For instance, if strategy B only spent $40,000 instead of $45,000/year, the approach would have been successful with a 99+% probability of success and, to be fair, that is about the same as strategy A, which was shown as a 100% probability of success when looking the risk of market volatility, but is really only 99% (or perhaps 99.9%) when considering the small-but-not-zero default risk of the insurance company.
If strategy B were adjusted to spend only $40,000/year and have a 99% probability of success similar to strategy A, the only difference between the two is the spending level: which is 33% higher, for life, as shown below!

Viewed another way, while the original strategy B had a 95% probability of success and a 5% probability of failure, the magnitude of that failure wasn’t very severe, and it wouldn’t take much of an adjustment to stay on track (cutting from $45,000/year to $40,000/year of spending is sufficient). Even with poor returns, there is only a 5% chance the portfolio runs out of money at all, and those scenarios don’t occur until almost 28 years into retirement. Spending would only need to be adjusted late in retirement – if at all – to stay on track, even if returns had been especially poor along the way.
Furthermore, for a 65-year-old couple, there’s a roughly 70% chance that both of them will have passed away by then anyway. Which means there’s a barely 30% probability that this 5%-failure risk is even relevant (i.e., the “joint probability” of both running out of money in their 90s and still being alive in their 90s is less than 2%). If there’s still a fear of bad returns, a mere 10% cut in spending will ensure the plan stays on track. Even if the spending cut does occur, strategy B still produces more retirement spending cash flow than strategy A!
Strategy C still turns out to be vastly inferior under the magnitude of failure approach, as the bad outcome can be very bad (flat broke by the 23rd year), and the size of the adjustment necessary to stay on track would be far greater than just a 10% spending reduction.
When weighing the magnitudes of failure (and the small or large adjustments to stay on track) against the higher spending levels, strategy A is inferior to strategy B, but strategy C is worse than both of them.
Measuring retirement outcomes based on utility functions and risk aversion
The conclusions of the prior section still presume that the retirees are comfortable with small and minor risks - but not all retirees will be comfortable facing such trade-offs, even those that are “minor” and of remote likelihood. Just because they have the financial capacity to take the risk still doesn’t mean they have the tolerance or desire to do so.
Conversely, the magnitude of potential adjustments for strategy C – which could fall seven years short on a 30-year retirement and need 20%-30% spending cuts to get back on track – will be untenable for many retirees, despite the materially higher initial spending amount.
In theory, these scenarios could be compared by quantifying how much “happiness” the retiree derives from greater spending, and weight it against the “unhappiness” of having a spending cut, along with how risk-averse the retiree is to the possibility such a cut would have to occur.
This is exactly what a retirement planning “utility function” measures. The purpose of a utility function is to assign a measuring unit – “utils” – to potential outcomes. More positive outcomes (e.g., higher spending levels) have higher utils. Adverse outcomes (e.g., spending cuts necessitated by the depletion or near-depletion of assets) have negative utils. We can then compare strategies by adding up the positive and negative “utils” over time to determine which creates the most satisfying net or cumulative outcome.
A key advantage of using a utility function is that it is possible to give different weights to positive versus negative outcomes – specifically, to assign greater negative weight to negative outcomes than positive weight to positive outcomes. In theory, this shouldn’t matter, because a rational human being should be indifferent to gains and losses, but the recognition that as human beings we have greater aversion to losses (“negative utils”) than the enjoyment we gain from favorable results (fewer “positive utils”) is the “Prospect Theory” first discovered by Daniel Kahneman and Amos Tversky, for which Kahneman won the Nobel Prize.
If investors were indifferent to relative gains and losses, the utility function (shown below) would be a straight diagonal line from the bottom left to the top right. Instead, to the upper right, the line begins to flatten, revealing that we have “diminishing marginal utility” for additional wealth. In practical terms, increasing your wealth by $1,000,000 if your prior net worth was $0 is a big deal (from poverty to being a millionaire!); increasing your net worth by $1M if you already had $99M is not such a big deal (it’s not as exciting for net worth to rise from $99M to $100M). Both are a $1M increase in wealth, but we weight the latter one less favorably because its value is diminished by the prior millions already accumulated.

The above Prospect Theory graphic also shows that when we lose money, we show a more “consistent” level of distress with both initial and extended losses (though the initial losses still sting more). Given that behaviorally, we do not weight gains in the same manner as offsetting losses (and vice versa), this makes it even more important to give each its appropriate weighting.
Risk aversion and optimal retirement strategies
The relative order of which is best or worst of our three strategies will depend heavily on how the retiree weights the positive utility of having more spending and wealth, versus the negative utility of being forced to cut spending in order to avoid running out of wealth altogether.
- For the highly risk-adverse retiree, who assigns an outsized negative weight (e.g., 5:1 or even 10:1) to spending cuts over spending gains, the best strategy is the all-annuity strategy A, which has the lowest probability of spending cuts, and does not incur any market volatility (and thus no negative utils from bear markets along the way). For this retiree, anything that decreases wealth – temporarily with market volatility or permanently and necessitating spending cuts – will be inferior and have a negative utility.
- For the risk-tolerant retiree who is far more sanguine about potential losses (or is more flexible to accommodate them with spending adjustments) and places a greater weighting on upside potential and enjoying more money today, strategy C could be optimal. This strategy has a whopping 25% probability of necessitating a spending adjustment, and could require a 25%+ spending cut to get back on track. For the retiree who doesn’t mind the downside risk if it means a better-than-50% chance of getting to spend more, this may be an appealing trade-off. Strategy A once again goes from being best to worst, and strategy C is superior.
- For the retiree in the middle – who perhaps is negative about spending cuts but is willing/able to tolerate them as long as they’re likely to be rare and infrequent – strategy B turns out to be the best strategy, because it has the most appealing balance. For this retiree’s utility function, strategy A doesn’t bring enough upside happiness, strategy C exposes the retiree to too much downside unhappiness.
In order to determine which strategy is best, given the potential for and tradeoffs inherent in upside wealth and downside spending cuts, it’s necessary to score both the upside and the downside. How those outcomes are weighted will depend on the retiree‘s preferences for managing downside risk and enjoying upside return (i.e., his/her personal utility function).
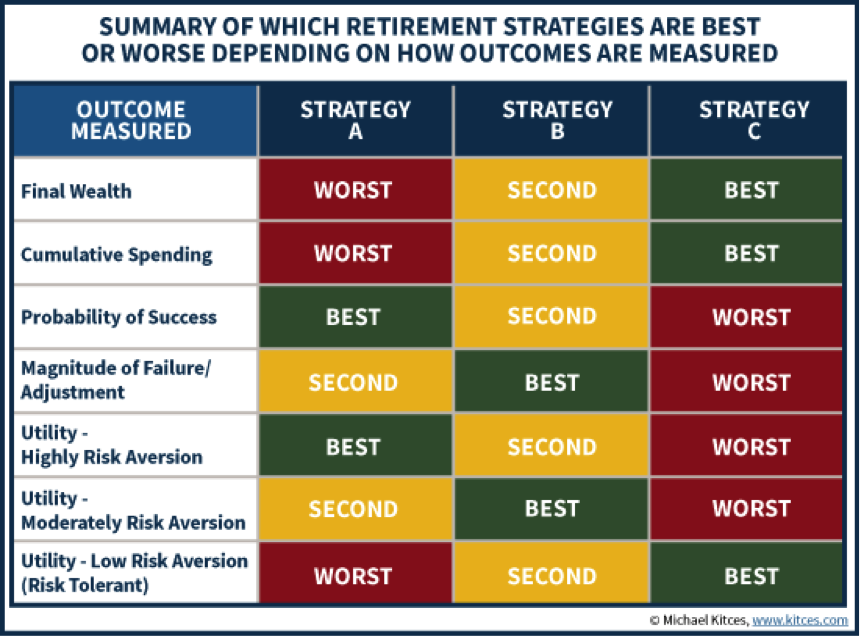
Determining the best retirement strategy depends on how it’s measured
As this discussion shows, determining the best financial planning strategy is heavily reliant on the metric used to quantify the outcomes. In our three strategies – annuitizing most of a portfolio for guaranteed income, taking moderate distributions from a growth portfolio or taking large distributions from an aggressive portfolio – the outcomes were variously best, second or worst, depending on how the outcome was measured, as shown in the summary below.
Careful thought about how a strategy will be evaluated is an essential aspect of the process in crafting financial planning recommendations. The issue is akin to what a scientist analyzing a problem has to consider: The research methodology will impact the conclusion, so it’s crucial to vet not just the results but the methodology itself. Otherwise, an imperfectly designed research study can yield a flawed conclusion.
For instance, imagine a medical study analyzing a weight-loss drug in the hopes that reducing obesity will cut down on deaths from complicating factors such as diabetes and high blood pressure. The research focuses on whether the drug leads to weight reduction, and finds that it does, concluding it’s a good drug. However, side effects of the drug include a significant increase in the risk of cancer and stroke! As a result, the drug does “cure” obesity but actually increases the ultimate risks of death that losing weight was meant to help minimize. In this context, if you measure “impact on weight loss,” the drug is a success, but when measured by “impact on overall health,” it’s actually a failure.
When it comes to financial planning, the situation is complicated by the fact most clients have multiple and complex goals and preferences. Accordingly, it’s impossible to establish financial planning strategies that are objectively dominant and superior in all situations. At best, some products or solutions are better than others for a particular goal, or subject to particular constraints and client risk tolerance or other preferences.
For example, an emergency savings fund invested in a money market that yields 1% is clearly better than one that only yields 0.1%, and for the “core” indexing portion of a retirement account an S&P 500 index with an expense ratio of 0.1% is better than one with an expense ratio of 1%. Nevertheless, whether the high-yield money market or the low-cost index fund are best depends on the retiree’s goals (accumulating versus saving for an emergency fund) and tolerance for risk. With the caveat that because of our behavioral biases, even with stable risk tolerance our perceptions of these risks may be distorted in a way that inappropriate impacts our decisions (which is a discussion for another day!).
In the end, then, evaluating which retirement strategy is best requires both a process to objectively analyze the scenarios and a careful consideration of what tools will be used to do the measuring and evaluate the outcomes, to properly fit them into a client’s preferences and tolerance for risk!
This article may have been edited ([ ]), abridged (...) and/or reformatted (structure, title/subtitles, font) by the editorial team of munKNEE.com (Your Key to Making Money!) to provide a faster ...
more
Comments
 No Thumbs up yet!

