
When Will Rising Interest Rates Become A Major Problem For The Stock Market
The title of this discussion is a trick question. The reason is that while rising interest rates put downward pressure on some stock market sectors during some periods, it is not clear that rising interest rates bring about major, broad-based stock market declines. After all, the secular equity bull market that began in the early-to-mid 1940s and ended in the mid-to-late 1960s unfolded in parallel with a rising interest-rate trend.
The conventional wisdom that rising interest rates eventually become a major problem for the stock market exists for two inter-related reasons. First, there is a strong tendency for major equity market declines to be preceded by a sustained and substantial tightening of monetary conditions. Second, it is common for a substantial tightening of monetary conditions to be accompanied by rising interest rates.
However, a sustained and substantial tightening of monetary conditions would bring about major weakness in the stock market even if interest rates were low or falling. This, in essence, is what happened during 2007-2008. The corollary is that a rising interest-rate trend would never become a major problem for the overall stock market as long as monetary conditions remained sufficiently accommodative.
The point is that when assessing the prospects of the stock market we should be more concerned about monetary conditions than interest rates because it isn’t a given that rising interest rates indicate tightening monetary conditions or that falling interest rates indicate loosening monetary conditions. How, then, do we know the extent to which monetary conditions are tight or loose?
One of the most important indicators, albeit not the only useful indicator, is the growth rate of the money supply itself.
Good economic theory informs us that rapidly inflating the money supply leads to a period of unsustainable economic vigour called a boom and that the boom begins to unravel after the monetary inflation rate slows. Over the past 25 years, booms have begun to unravel within 12 months of the year-over-year growth rate of G2 (US plus eurozone) money supply dropping below 6%.
The following chart shows the year-over-year growth rate of G2 True Money Supply (TMS), with a horizontal red line drawn to mark the 6% growth level mentioned above and vertical red lines drawn to mark the official starting times of US recessions. In the typical sequence, there is a decline in the G2 monetary inflation rate below 6%, followed within 12 months by the start of an economic bust (the unravelling of the monetary-inflation-fuelled boom), followed within 12 months by an official recession.
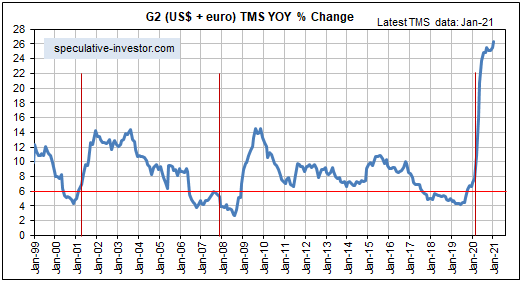
The time from a decline in the G2 monetary inflation rate to below 6% to the start of a recession can be two years or even longer, but the broad stock market tends to struggle from the time that the boom begins to unravel. This typically occurs within 12 months of the monetary inflation rate dropping below 6%, regardless of what’s happening with interest rates.
Now, it’s likely that the unravelling of the current boom will begin with the monetary inflation rate at a higher level than in the past. However, with the G2 TMS growth rate well into an all-time high territory and still trending upward, it is too soon (to put it mildly) to start preparing for an equity bear market.


