
The "Monthly Macro" post is a once-per-month, informative article that helps investors develop a more strategic view of the world through a deeper understanding of the economy, interest rates, and the impacts of government policy.
What Is A Recession & Are We In One Now?
With the stock market tumbling and a negative sign in front of the first-quarter GDP report, the "R" word has started to circulate with increasing concern among investors.
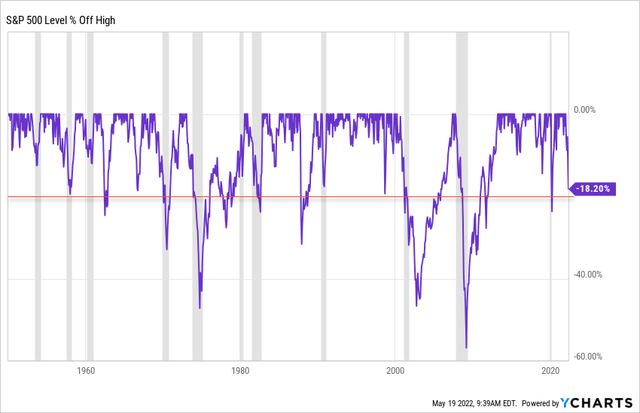
Historically, it is uncommon for the broad S&P 500 to decline more than 20% without the economy actively experiencing a recession or a recession that follows in the next couple of months.
In this article, we will take a look at the technical definition of a recession and assess whether the US economy is heading for a recession, is currently in a recession, or will ultimately avoid a recession in the coming quarters.
What Is A Recession?
Despite popular opinion, a recession IS NOT defined as two consecutive quarters of negative real GDP.
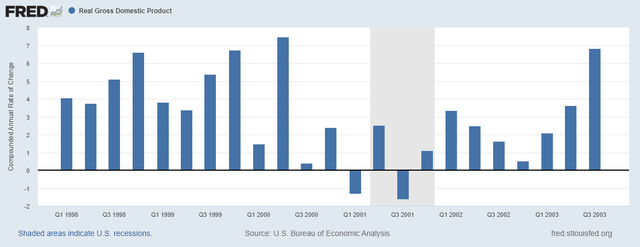
We can verify the mythology of this popular rule of thumb by looking at the mild 2001 recession.
Real GDP was negative for two months in total but never twice consecutively. However, a recession was still declared by the National Bureau of Economic Research or NBER.
So if a recession is not two consecutive quarters of negative real GDP, then what is the definition?
The NBER defines a recession as:
...a significant decline in economic activity that is spread across the economy and that lasts more than a few months.
Real GDP is often used as a proxy because it captures many areas of the economy, but the measure of real GDP doesn't consider the income side of the equation. Real GDI measures the economy from the income side, and there's often a statistical discrepancy between real GDP and real GDI.
To measure how widespread the change in economic activity is, the NBER uses reliable indicators from all segments of the economy.
These include real personal income less transfers, nonfarm payroll employment, real personal consumption expenditures, wholesale-retail sales adjusted for price changes, employment as measured by the household survey, and industrial production.
Followers of EPB Macro Research are familiar with these indicators as they comprise the EPB 4-Factor Coincident Index of real growth.
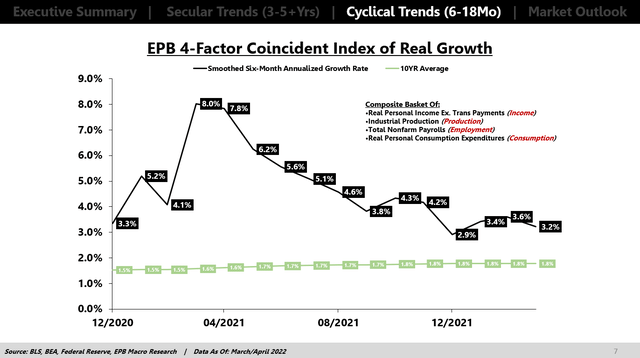
This coincident index provides a real-time measure of economic activity across all four corners of the economy: income, production, consumption, and employment.
To get even more specific, the NBER admits that in recent history, they have focused on two indicators more heavily:
In recent decades, the two measures we have put the most weight on are real personal income less transfers and nonfarm payroll employment.
To summarize, to characterize the economy as in a recession, we need to make the case that there's been a widespread contraction in economic activity seen across income, consumption, production, and employment.
Importantly, these measures are also excluding inflation, so the contractionary conditions must be met in real terms.
Is The Economy In A Recession?
As it stands today, the US economy is on a pre-recessionary path but not yet in a recession.
If we focus on the NBER's two preferred measures, we can see that real income is already recessionary. Real income growth has declined to nearly 0% on a smoothed six-month annualized basis and has contracted in four of the last eight months.
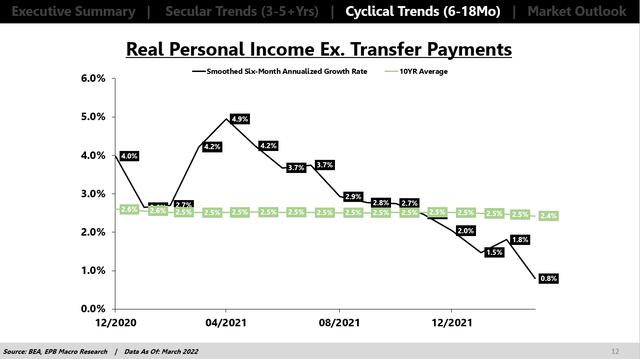
If real income were the only measure, then recessionary conditions would be nearly satisfied. Real income is only one of four key measures of widespread economic activity and only one of two indicators if we are narrowing the scope to income and employment.
On the other hand, employment growth is still rising and well above the long-term trend of 1.2%.
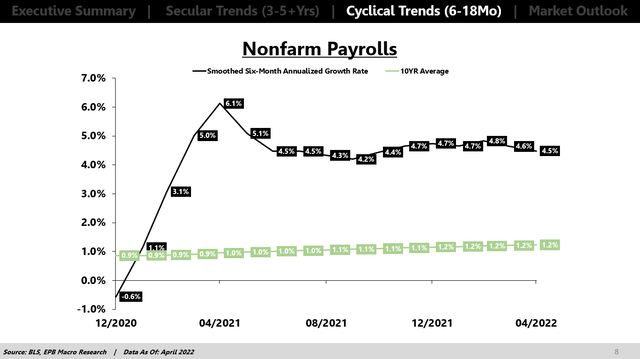
Employment growth is too strong for the economy to be in a recession currently, even on the most narrow two-factor measurement of the economy (income and employment).
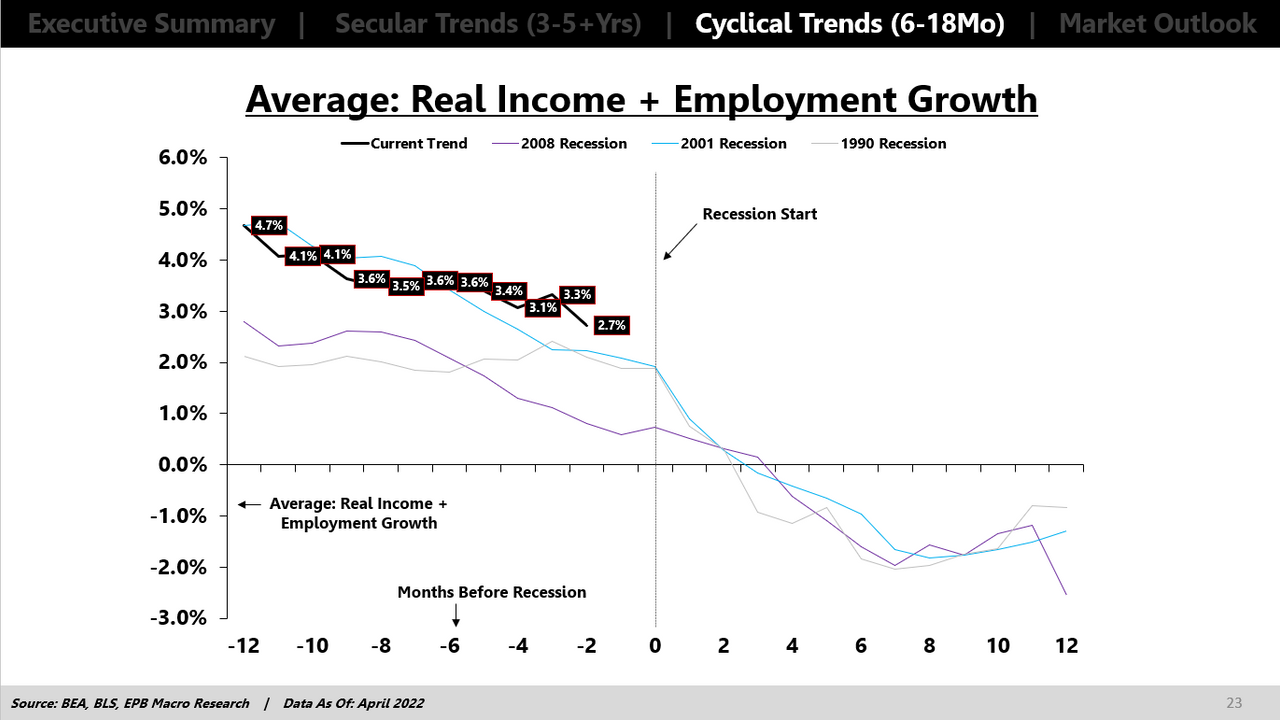
The chart below takes the average growth rate of real income and employment and compares the trending direction to three past recessionary periods. The COVID recession was excluded because it was not cyclical but instead mandated.
The first point to note is the direction of growth. Followers of EPB Macro Research know that the direction of growth is far more important than the level of growth. In all three recessionary episodes, the average of income and employment growth were in a declining trend.
When the recession started, the average growth of income and employment was in the 1%-2% range. Since recessions are dated in hindsight, what made the three periods charted below "recessions" is the follow-through to negative growth.
In other words, the economy is not in a recession today. To make a recessionary argument, you have to make a case that the average of income and employment growth will follow through into negative territory over the next 6-8 months.
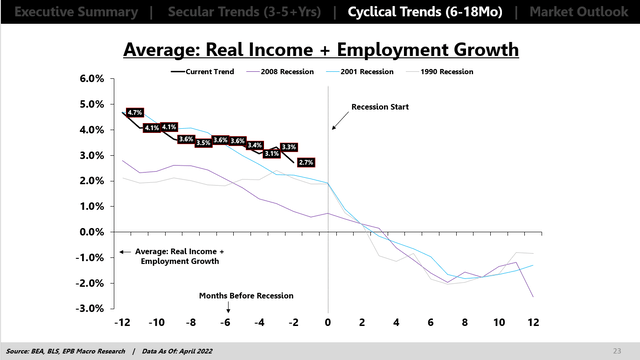
However, it is noteworthy in the three recessionary episodes that the average of income and employment growth deteriorated from +2% to -2% within six months.
While the growth rate of income and employment is too high for a recession today, the picture can be totally different six months from now.
To understand where we are going, we need first to respect the direction of growth, and second, we need to study leading economic indicators.
The trend in growth is downward and economic growth has been declining since April 2021. Whenever economic growth is declining, recession risk is rising because, with each passing day, you are moving closer to the 0% level.
Real income growth is already recessionary, but employment growth is not. A recessionary situation developing in the next 6-8 months more than likely needs to be met with a significant decline in employment growth.
Investment Implications
There is no material difference in terms of asset allocation implications between "declining growth" and a "recession."
All recessions are periods of declining growth.
Economic growth is clearly declining and has been softening since April 2021. Whenever economic growth declines, recession risks rise, and defensive exposures often outperform risky or offensive exposures.
For example, since April 2021, utilities ETF XLU is up 14.5% compared to a decline of 1% for the broader S&P 500. Risky pockets of the stock market like small caps are down more than 20% from the April 2021 inflection in economic growth.
So when economic growth is declining, you want to be defensive and take less risk. Currently, economic growth is declining.
The next major question is whether there is something on the horizon that would make economic growth start to accelerate before crossing the 0% level. That would be a "soft landing," and if the economy achieves a soft landing, the time to start accumulating risk assets is near as broad declines of more than 20% are historically uncommon without a hard-landing/recession.
I use leading economic indicators to determine a potential change in trend on the horizon, and there's nothing to suggest a change is imminent.
The US economy is not in a recession today but rather is in a pre-recessionary state with declining growth and will continue moving in that direction over the next several months.
Risk assets will not have the all-clear sign until recession risk is off the table, and recession risk cannot be eliminated while economic growth is decelerating.
More By This Author:
Fiscal Stimulus: The Economy's Third StrikeIs Your Portfolio Suffering From The Coronavirus Outbreak?
Despite "Valuation Hawks", Utilities Continue To Be The Market Leader


Comments
Log in or sign up to join the conversation.