
Weighing The Week Ahead: Investors Can Always Learn Something From Mr. Buffett
We have a big economic calendar including important data on consumer confidence, personal income and spending, and inflation. There will also be another round of housing news – two measures of prices, new home sales, and pending home sales. While it is not expected to change, the second estimate of Q4 GDP will be reported.
While these economic reports will claim attention later in the week, we know how it will start. The punditry will be asking: What does Warren think?
And then they will offer their own opinions.
Last Week Recap
My last installment of WTWA, I emphasized housing data and trends, partly because so many key reports were coming out. The media followed this topic in some segments, but sometimes suggesting there was a “crisis” because of shortages and affordability. Even investment programs did not pay much attention to the opportunities for investors in this sector. The sector data continues to be excellent. As I suggested last week, there is plenty of room left in this powerful, long-term trend.
Coronavirus Update
New developments suggest coronavirus incubation could be longer than 14 days, as global infections rise. This may be part of the explanation for the rise in infections in South Korea, Japan, Iran, and Italy. CDC is preparing for the ‘likely’ spread of coronavirus in the US, officials say
How COVID-19 Is Spread includes the latest scientific interpretation of facts, suspicious, and the discounted rumors.
Veteran market observer Josh Brown does not think the effect is reflected in current stock prices. A case or two in New York would change that quickly, he suggests.
Media sources are blaming the coronavirus for end-of-the week selling. Paul Schatz wisely notes that the economic effects have been widely expected, so this makes little sense. He sees Yen weakness as “the quiet culprit.”
The key question for the market remains: Will this be a contained, mostly China event lasting a couple of months? Or is a pandemic in store?
The Story in One Chart
I always start my personal review of the week by looking at a great chart. This week I am featuring Investing.com’s version. If you go to the interactive chart online, you can see the news behind each of the “N” callouts.

The market lost 1.2% for the week, all in the last two days. The trading range was 4.5%. You can monitor volatility, implied volatility, and historical comparisons in my weekly Indicator Snapshot in the Quant Corner below.
Noteworthy
Statista reports on the growing cost of Internet crime.

The News
Each week I break down events into good and bad. For our purposes, “good” has two components. The news must be market friendly and better than expectations. I avoid using my personal preferences in evaluating news – and you should, too.
New Deal Democrat’s high frequency indicators are an important part of our regular research. This report is fact-based and consistent with the choice of indicators. Consideration of three different time frames helps to clarify economic changes. This week shows an unusual pattern: positive long and short-term indicators, but a slightly negative “nowcast.” NDD highlights the sharp improvement in manufacturing new orders as well as some weakening in consumer spending and continued weakness in production. NDD continues his focus on the consumer.
The Good
-
Regional Fed Surveys were strongly positive. I don’t regard these as especially important, but neither is the Markit PMI, which got a lot of buzz on Friday because it was below 50. I do not report this indicator because we know little about how it is collected, nothing about the confidence interval, and have only a very short history. Some thought that the market decline on Friday was the result of this report. Wow! The regional Fed info has a longer history and better links to reports that are known to be important.
- Empire state manufacturing registered 12.9 versus January’s 4.8 and expectations of 6.3.

- The Philly Fed index was 36.7 versus January’s 17.0 and expectations of 10.7.

-
Housing starts for January were 1567K (SAAR) beating expectations of 1390K but lower than December’s upwardly revised 1626K.Calculated Risk writes (emphasis in original):
These were blow out numbers! Starts in December were at the highest level for starts since December 2006 (end of the bubble). However, the weather was very nice again in January (just like in December), and the weather probably had a significant impact on the seasonally adjusted housing starts number. The winter months of December and January have the largest seasonal factors, so nice weather can really have an impact.
Scott Grannis does a chart-filled update of the underlying housing factors – builder sentiment, permits, mortgage rates, mortgage delinquencies, and the strong financial shape of households. He calls the result “truly impressive.” Here is a chart most do not often see.

- Building permits for January showed similar strength, 1551K (SAAR). This beat expectations of 1460K and December’s 1420K.
- Mortgage delinquencies reached the lowest level on record. (Calculated Risk).
- Leading indicators for January increased 0.8%, better than expectations of 0.4% and much better than December’s decline of 0.3%.

The Bad
- The NAHB housing market index for February registered 74, slightly lower than expectations of 75, which was also January’s result.

- Mortgage applications declined 6.4% compared to last week’s gain of 1.1%
- Rail traffic returned to contraction via the expert analysis of Steven Hansen (GEI). His approach smooths data and focuses on the important economic aspects.
-
PPI increased 0.5% on both the headline and the core. This was significantly higher than expectations of a 0.1% gain, which was also the December result. Is this evidence of incipient inflations? Barron’s suggests, Inflation Isn’t Missing From the U.S. Economy. You Just Need To Know Where to Look for It.
“If I were just landing from the moon, I’d ask what am I missing. Every pundit says there’s no inflation, and I’m just not there,” said Lisa Shalett, chief investment officer at Morgan Stanley’s wealth-management unit. Inflation is evident in the services part of the U.S. economy, she said, and it’s particularly acute in rent and health care.
Total PPI rose 2.1% last month, up sharply and unexpectedly from December and at the fastest pace since April. Economists surveyed by Bloomberg expected a 1.6% increase. Shalett says a quicker pace of producer inflation is worth heeding; it undercuts the idea that overall inflation is cool because the prices of goods are sluggish and thereby are offsetting rising prices elsewhere in the economy.
The Ugly
How Chaos at Chain Pharmacies Is Putting Patients at Risk
In letters to state regulatory boards and in interviews with The New York Times, many pharmacists at companies like CVS, Rite Aid and Walgreens described understaffed and chaotic workplaces where they said it had become difficult to perform their jobs safely, putting the public at risk of medication errors.
They struggle to fill prescriptions, give flu shots, tend the drive-through, answer phones, work the register, counsel patients and call doctors and insurance companies, they said — all the while racing to meet corporate performance metrics that they characterized as unreasonable and unsafe in an industry squeezed to do more with less.
The Week Ahead
We would all like to know the direction of the market in advance. Second best is planning what to look for and how to react.
The economic calendar is a big one including a variety of themes. Consumer confidence remains important as does personal income and spending. The Fed’s favorite inflation measure (Core PCE prices) is reported on Friday. We’ll have more housing data on new and pending home sales as well as prices. The second estimate of GDP is not expected to change, but it could be a story.
And of course, there will be election news and accompanying Twitter commentary.
Briefing.com has a good U.S. economic calendar for the week. Here are the main U.S. releases.

Next Week’s Theme
There is plenty of data on tap this week to complement the election news and coronavirus coverage. While the story might not last for more than a day, I expect plenty of attention to Warren Buffett’s annual shareholder letter. I expect discussion from many different perspectives as pundits ask: What does Warren think?
Background
There will be many summaries of the annual letter. There is also a lot of misinformation. Rather than highlight these other viewpoints, I have a different approach in mind this week. I will pick a few items that have the biggest potential payoff for the average investor. I enjoyed reading the letter with that thought in mind, and I hope it is useful for readers as well.
- What is good performance? Start by looking carefully at the performance report.

This deserves some special charting, but I hope a few things stand out.
- The S&P comparison is wildly variable. Look at the period from 1998 – 2005. Look at the 1971 – 1985 period. These changes are not just a few percentage points. There are big gains when the market did nothing and losses when the market was doing well.
- The performance is not smooth. And the large variations are not match by a similar move in markets. Look at 2019. Do you suppose Mr. Buffett is getting questions from clients asking why their stock is not at a new all-time high like the market?
Perhaps the biggest thing to learn is that the strongest long-term performance is not a smooth, market-beating run. It just doesn’t work that way. The corollary is that you need to understand the method, not just look at performance.
The problem for investors is that checking performance is easily accomplished and seems smart. Few have any clue about how to evaluate differing investment methods.
-
Berkshire emphasizes investments in companies that effectively use retained earnings.
At Berkshire, Charlie and I have long focused on using retained earnings advantageously. Sometimes this job has been easy – at other times, more than difficult, particularly when we began working with huge and evergrowing sums of money. In our deployment of the funds we retain, we first seek to invest in the many and diverse businesses we already own. During the past decade, Berkshire’s depreciation charges have aggregated $65 billion whereas the company’s internal investments in property, plant and equipment have totaled $121 billion. Reinvestment in productive operational assets will forever remain our top priority.
In companies where Berkshire owns more than 50% of the shares, the earnings flow directly into operating earnings. But what about the others?
In the non-controlled companies, in which we own marketable stocks, only the dividends that Berkshire receives are recorded in the operating earnings we report. The retained earnings? They’re working hard and creating much added value, but not in a way that deposits those gains directly into Berkshire’s reported earnings. At almost all major companies other than Berkshire, investors would not find what we’ll call this “nonrecognition of earnings” important. For us, however, it is a standout omission, of a magnitude that we lay out for you below. Here, we list our 10 largest stock-market holdings of businesses. The list distinguishes between their earnings that are reported to you under GAAP accounting – these are the dividends Berkshire receives from those 10 investees – and our share, so to speak, of the earnings the investees retain and put to work. Normally, those companies use retained earnings to expand their business and increase its efficiency.
- Berkshire uses operating earnings.
Why? It is a more accurate concept for their process than GAAP. Keep this in mind when reading material from those on my “reliably bearish commentary” Twitter list.
-
Berkshire does not object to share buybacks.
…they use those funds to repurchase significant portions of their own stock, an act that enlarges Berkshire’s share of the company’s future earnings.
The letter lists the top ten largest stock market holdings, with this conclusion:
But both logic and our past experience indicate that from the group we will realize capital gains at least equal to – and probably better than – the earnings of ours that they retained. (When we sell shares and realize gains, we will pay income tax on the gain at whatever rate then prevails. Currently, the federal rate is 21%.) It is certain that Berkshire’s rewards from these 10 companies, as well as those from our many other equity holdings, will manifest themselves in a highly irregular manner. Periodically, there will be losses, sometimes company-specific, sometimes linked to stock-market swoons. At other times – last year was one of those – our gain will be outsized. Overall, the retained earnings of our investees are certain to be of major importance in the growth of Berkshire’s value.
- The Berkshire portfolio emphasizes plenty of financial stocks, very unpopular and cheap in the current market. Beating the S&P without over-owning FAANG is a real challenge. Perhaps that should not be your short-term goal. Think farther ahead.

As usual, I’ll describe more of my own conclusions in today’s Final Thought.
Quant Corner and Risk Analysis
I have a rule for my investment clients. Think first about your risk. Only then should you consider possible rewards. I monitor many quantitative reports and highlight the best methods in this weekly update, featuring the Indicator Snapshot.
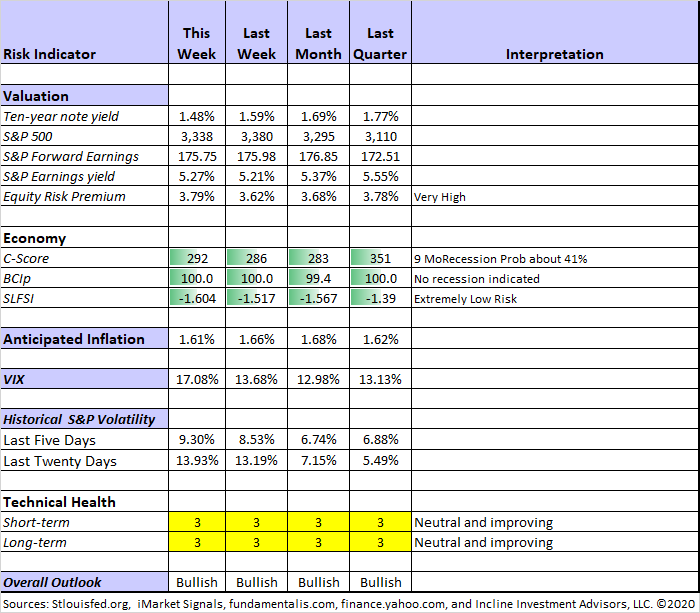
Both long-term and short-term technical indicators remain neutral, but weakened despite the rally.
The C-score remains in a zone which suggests that we watch for confirming data. Like others, we don’t see much of that.
The Featured Sources:
Bob Dieli: Business cycle analysis via the “C Score”.
Brian Gilmartin: All things earnings, for the overall market as well as many individual companies. Brian has a great highlight of the top ten stocks in the S&P 500. Welcome Procter & Gamble (PG) and Visa (V). This reinforces one of my own frequent points. When you buy an index ETF you are loading up on the current top cap stocks, not the ones that will move in. The leadership changes much more than most would think.
Georg Vrba: Business cycle indicator and market timing tools. The most recent update of Georg’s business cycle index does not signal recession.
Doug Short and Jill Mislinski: Regular updating of an array of indicators. Great charts and analysis, including regular updates of the Big Four.
Guest Sources
John Butters observes that the S&P 500 Forward 12-month P/E ratio has hit 19.0 for the first time since 2002. I often cite FactSet, but recommend that this information be considered in the context of anticipated inflation and interest rates, as I do every week in the Indicator Snapshot. If inflation expectations are high, investors demand more yield from both stocks and bonds.


Bob Dieli has some important commentary on the yield curve. This is crucial analysis that you will not see elsewhere, especially in the sea of newbie yield-curve pundits. I need to post two of the many charts to convey the full importance.


Is there too much brick and mortar retail space? This is relevant for both the retail companies and the mall REITs. David Templeton (HORAN) has a nice analysis of the issue.

Insight for Investors
Investors should understand and embrace volatility. They should join my delight in a well-documented list of worries. As the worries are addressed or even resolved, the investor who looks beyond the obvious can collect handsomely
Best of the Week
If I had to recommend a single, must-read article for this week, it would be Warren Buffett’s annual letter. I hope you appreciate my own summary which I expect to be different from any of the others you read. And that is my point. What people take away from information is a very personal thing. There is no substitute for reading this yourself. It is only 14 clearly written pages! I recommend asking questions like the following:
- What does Mr. Buffett look for that I might be missing?
- Are my own worries the same as his?
- If I had a conversation with him, is there anything I might suggest about investing?
- Should I use his holdings as a list of “stock tips” for my own investing?
Please think of more questions and add them in the comments to help all of us.
Stock Ideas
A bull market in gold stocks? Kirk Spano explains why it may be just beginning. Hint: A better balance in supply and demand after industry consolidation.
Time to build a stake in Caterpillar (CAT)? (Barron’s thinks so).
The Stanford Chemist provides an update on “quality” closed-end funds. Want to find discounts and modest risk? This is where to look.
Do you really buy at times when most are fearful? Brad Thomas offers Carnival Cruise Lines (CCL) as a good example. Attractive yield, sound company fundamentals, depressed price because of uncertainty. This is a good case study for long-term investors to consider. He also offers a quite different idea, Realty Income: The Bluest Of The Blue Chip REITs.

Wal-Mart – boring? Flight to quality? What’s the attraction? D.M Martins Research explains the advantage of solid diversification despite the earnings miss.
Barron’s identifies twelve stocks that will please both growth and value investors. (Jeff – I’m not so sure of that, but there are some interesting ideas).
Qualcomm (QCOM) may face near-term pressure from the COVID-19 epidemic, but the truce with Apple is far more important to the long-term picture opines Valuentum.
Waiting
Wayfair (W) is worth watching (Stone Fox Capital). But wait for an explanation of the job cuts at a time of apparent growth.
Michael A. Gayed is interested in Abiomed (ABMD), but prefers to get more data from an upcoming study.
Annaly Capital Management (NLY) has become a bit too expensive, opines Colorado Wealth Management.
Cloud Center REITs are popular, but pricey reports Hoya Capital Real Estate.
The Great Rotation
Brian Gilmartin writes with honesty and passion. He has an obvious concern for his clients. This week he writes about one of the themes in the Great Rotation – one which hasn’t worked so far. He asks the classic manager question: Am I wrong or just early? Read the full story yourself, but here is a key aspect of the current analysis.
The China tariff talks and the re-routing of the global supply chain was the first drag on the asset class, Brexit was probably the second drag as Germany and the UK are the world’s 4th and 5th largest economies, and those economies slowing surely had some tangential impact on the asset class. Finally with the coronavirus outbreak potentially slowing China even more, and the stronger dollar (per CNBC’s Rick Santelli, who tracks the DXY, the US dollar hit a 33-month high this week), the question is how much longer can the asset class be run into the ground without some kind of a bounce.
The experts at MarketDesk suggest a slightly different approach – looking to Europe. Among their several reasons, including relative value is this indirect effect:
2. Embedded Optionality from Higher Emerging Markets Exposure: Europe tends to be more cyclical and exposed to emerging market (EM) growth than the U.S. Over the last decade, Europe’s EM exposure was a negative due to the impact from low global growth and weak commodity prices on EM economies. Now that a U.S.-China trade deal is signed and global central banks are engaged in monetary easing, Europe’s EM exposure turns into a positive in our view
I will analyze this question further, but my comment from last week is still valid. Flight-to-quality action is economic noise that makes Brian’s prior decision look wrong. I am joining him by including non-US markets as one of my themes. (I must confess that the current holdings on this theme are in Mexico and Canada, but there will be many more). Anyone who thinks this can be timed with precision is swinging out of his happy zone. [Jeff aside – I love that quotation from the Splendid Splinter. I also expect to enjoy my first Spring training game in the very near future].
Watch out for
- Long-time utilities bull Eric Basmajian says the exit opportunity is here. He has been more patient/bold/fortunate than almost everyone, including me. If you are a winner, there are times when you should just take the victory lap and move on.
- Blue Harbinger sees Tanger Factory Outlet Centers (SKT) as a value trap with share price risk. Read the post to see recommended alternatives.
Final Thought
Can we please, please, put to rest the Warren Buffett scare warnings. These are just cheap clickbait shots.
- He does not think the markets are about to crash. He states the opposite in every interview.
- He is not “talking his book” as we see from most fund managers. He has no reason to. He is giving his money to charity over a ten-year period. He is an honest man who is trying to do well for his investors. He has no reason to mislead the general public. (He is also a very tough and successful negotiator, but that is a different matter).
- He does not evaluate markets using the oft-quoted “Buffett Indicator” of stock market cap compared to GDP. Why not? He has stated for many years that it is not valid when interest rates are as low as they have been and expected to remain so. Anyone promoting this idea is either uninformed or dishonest.
- His cash accumulation does not reflect fear of the near-term market prospects, as it might for other managers. His insurance businesses generate plenty of float for investments. Most investments that the average person would consider do not move the needle for Berkshire Hathaway. His letter provides some specific criteria, including the difficulty of buying entire companies rather than minority interests.
This week’s market analysis was even worse than usual when it came to the never-ending quest for causation. A Thursday summary of the market moves included a laundry list of factors with multiple opinions on each. In one case the reason was a Chinese source where the article had come out many hours earlier. It did not really line up, stated the commentator, but it was widely cited by traders. We do not need to “explain” every 1% move. If we try, we will make many mistakes.
Learning from legends requires some modesty. If you think you already know the answers, you will never learn anything new.
Great Rotation Hint of the Week
I’m getting many reader questions about the Great Rotation. I have described the themes for several months, but there are always some new readers. I am using this approach in a few client accounts as well as my own personal account. I am excited about it. It is not yet an official program for my firm. Hint: Compliance and marketing.
Until we have more materials, readers can opt-in to an email list which describes our progress with the design of the program, provides detail on the themes, and analyzes a specific stock we have already purchased. There is no charge and no obligation for participants, and we will not use your email for any other purpose. You can opt-out whenever you wish, but I hope you don’t! Comments and reactions are an important part of my investment process. I welcome your participation. Just write to info at inclineia dot com]. I will add new installments on a regular basis, approximately weekly.
I’m more worried about
- Inflation. Will policymakers and investors see signs as they emerge, or wait until it is too late?
- The coronavirus expansion into new countries. This deserves constant attention.
- The reduction in investment ideas in the sources I read. This is why I included the “waiting” section this week. I am finding good ideas, but most others are serving up expensive stocks.
I’m less worried about
- Investment effects from the 2020 election. So many are rushing to conclusions about a very uncertain event. This makes a big mistake more likely than usual.
We have a new (free) service to subscribers to our Felix/Oscar update list. You can suggest three favorite stocks and sectors. We report regularly on the “favorite fifteen” in each ...
more

