

Image Source: Pexels
Here are three things I think I am thinking about this weekend:
1) Is the Disinflation Trend about to Gain Momentum Again?
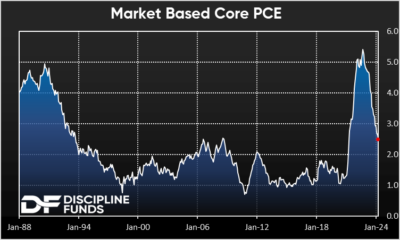
Friday’s PCE report showed further improvement in inflation down to 2.75% compared to the year-ago rate of 4.76%. There has been a lot of commentary in recent months about a resurgence in inflation or a failure of the Fed to get to its target and while the progress has slowed the trend is still clearly in place and likely to gain momentum to the downside in the remainder of the year. One problem with the recent data is that much of it is appearing sticky due to imputed costs such as financial services fees which surged in the beginning of the year.
Luckily, the BEA also tracks Core PCE without these imputed costs and when you look at that data it shows a much clearer downward trend. This “market based Core PCE” takes a lot of the guesswork out of inflation assumptions and came in at 2.52% in April, down from 2.62% in March. This is big improvement compared to a year ago and it’s awfully close to giving the Fed the all clear on rate cuts. Most importantly, I don’t see any signs that inflation is gaining upside momentum. Shelter prices remain subdued, commodities are flat year over year, wages are slowing steadily and most price diffusion indices have trended down and stayed down.
We’re not there yet, but when I look under the hood I still think it’s clear that disinflation is the most likely outcome for the remainder of the year and I wouldn’t be surprised if rate cuts come back into full view as the summer comes to an end.
2) The Most Bullish Chart in the World
If I had to pick a single macro trend that I am most bullish about it is definitely technology changes. But where are we in the tech growth curve? You might be inclined to think tech trends are a little long in the tooth and that might be true as they pertain to market prices, but let’s look at something more fundamental like e-commerce sales as a percentage of total sales.
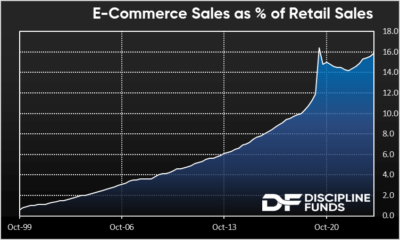
The nice thing about this data is that it’s brand new starting in 1999 with the advent of the internet. And it just climbs a little bit higher each and every year. As of 2024 we’re at just 15.9%. It’s impossible to know how high this percentage will climb, but at 15.9% I think it’s still safe to say that we’re still in the early stages of technology development. I don’t think it’s unreasonable to assume that this data could double from here and possibly even triple if we assume some outsized changes in the way we consume certain goods over the coming 50-100 years. Said differently, Marc Andreessen was right – tech is eating the world and we’ve only been served the appetizers so far.
Of course, market prices can and often do tell a totally different story. In 1999 e-commerce retail sales were virtually 0% and yet internet companies were valued as though retail sales were already 15.9%. They weren’t wrong, they were just early. And that’s what makes investing so hard – there’s always a temporal conundrum in the way investors price in certain trends and those assumptions can get wildly out of whack in the short-term. But if you’ve got a very long time horizon I find it virtually impossible to believe that this trend isn’t very early in the making.
3) Core Necessities vs Core Inflation
I joined Charles Payne on Fox Business to discuss my recent research on consumer sentiment and why people are still so negative about the economy. My basic view is that it’s all about “core necessities”. I like to measure living standards in part by how much it costs to buy necessities. There was a fantastic study from the BLS in 2015 which showed that we spent 80% of income on clothing, food and shelter in 1900. By 2015 that figure was down to 45%. Our living standards improved so much that items once viewed as luxuries are now viewed as necessities. A person living in 1900 could barely imagine the luxury of modern medical care or even a college education, but now we talk about these items as though they’re necessities because we’ve filled that 35% empty space in income with other items.
This is a good thing and it shows that our living standards have surged over the last 124 years. But the problem in recent years is that many of the items we now view as necessities have lagged wage gains. Shelter is especially problematic as the cost of a mortgage and homeownership exploded in 2021 and 2022. But other items have failed to keep pace as well including food, cars and gasoline. Some of these are items that economists like to strip out of inflation metrics because they can be volatile, but they’re everyday necessities to real consumers. And I think that’s where the problem exists. While many pundits tell us that everything is great the reality is that many people feel like their living standards have moved mostly sideways for the last 5 years because our incomes don’t buy the same quantity of necessities as they once did. So yes, while many things are improving and the more recent trends look much improved I think there’s a pretty reasonable explanation for why so many people are down on the economy and it’s not just a partisan political view. It’s a real inflation problem where core necessities have outstripped wage gains over the last 5 years.
Anyhow here’s the clip. I hope you enjoy it and have a great weekend.
Video Length: 00:03:14
More By This Author:
This Is Why Consumers Are So NegativeThree Things – Monetization, Sentiment And Real Wealth
Three Things – CPI, Davey Day Trader And Stagflation


Comments
Log in or sign up to join the conversation.